Introduction to Advertising Measurement
Revised August 2026 | License: CC BY 4.0 | We use javascript to track readership.
Our main goal is to help advertisers make better decisions. We welcome reuse with attribution. Please share widely.
What you will get from this deck
- One day soon, someone may ask, or tell, you how well the ads worked
- After reading, you will be able to:
- Identify incentive conflicts in the advertising supply chain
- Describe pros & cons of major advertising measurement methods
- Understand how multiple methods may be productively combined to optimize spending allocations under a budget
- This knowledge can help you balance maximizing advertising profits with returning profits to shareholders

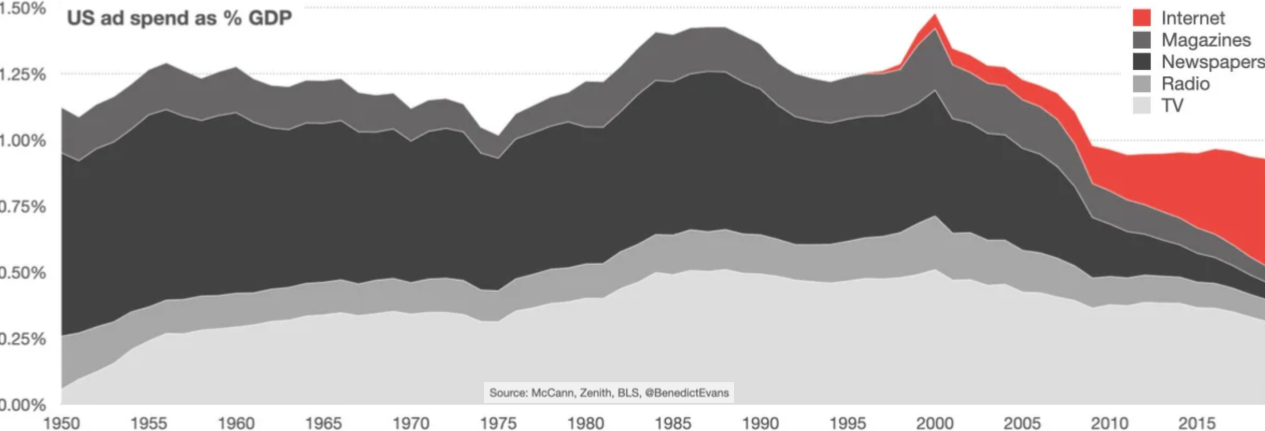
Advertising sales revenue, 1950-2019
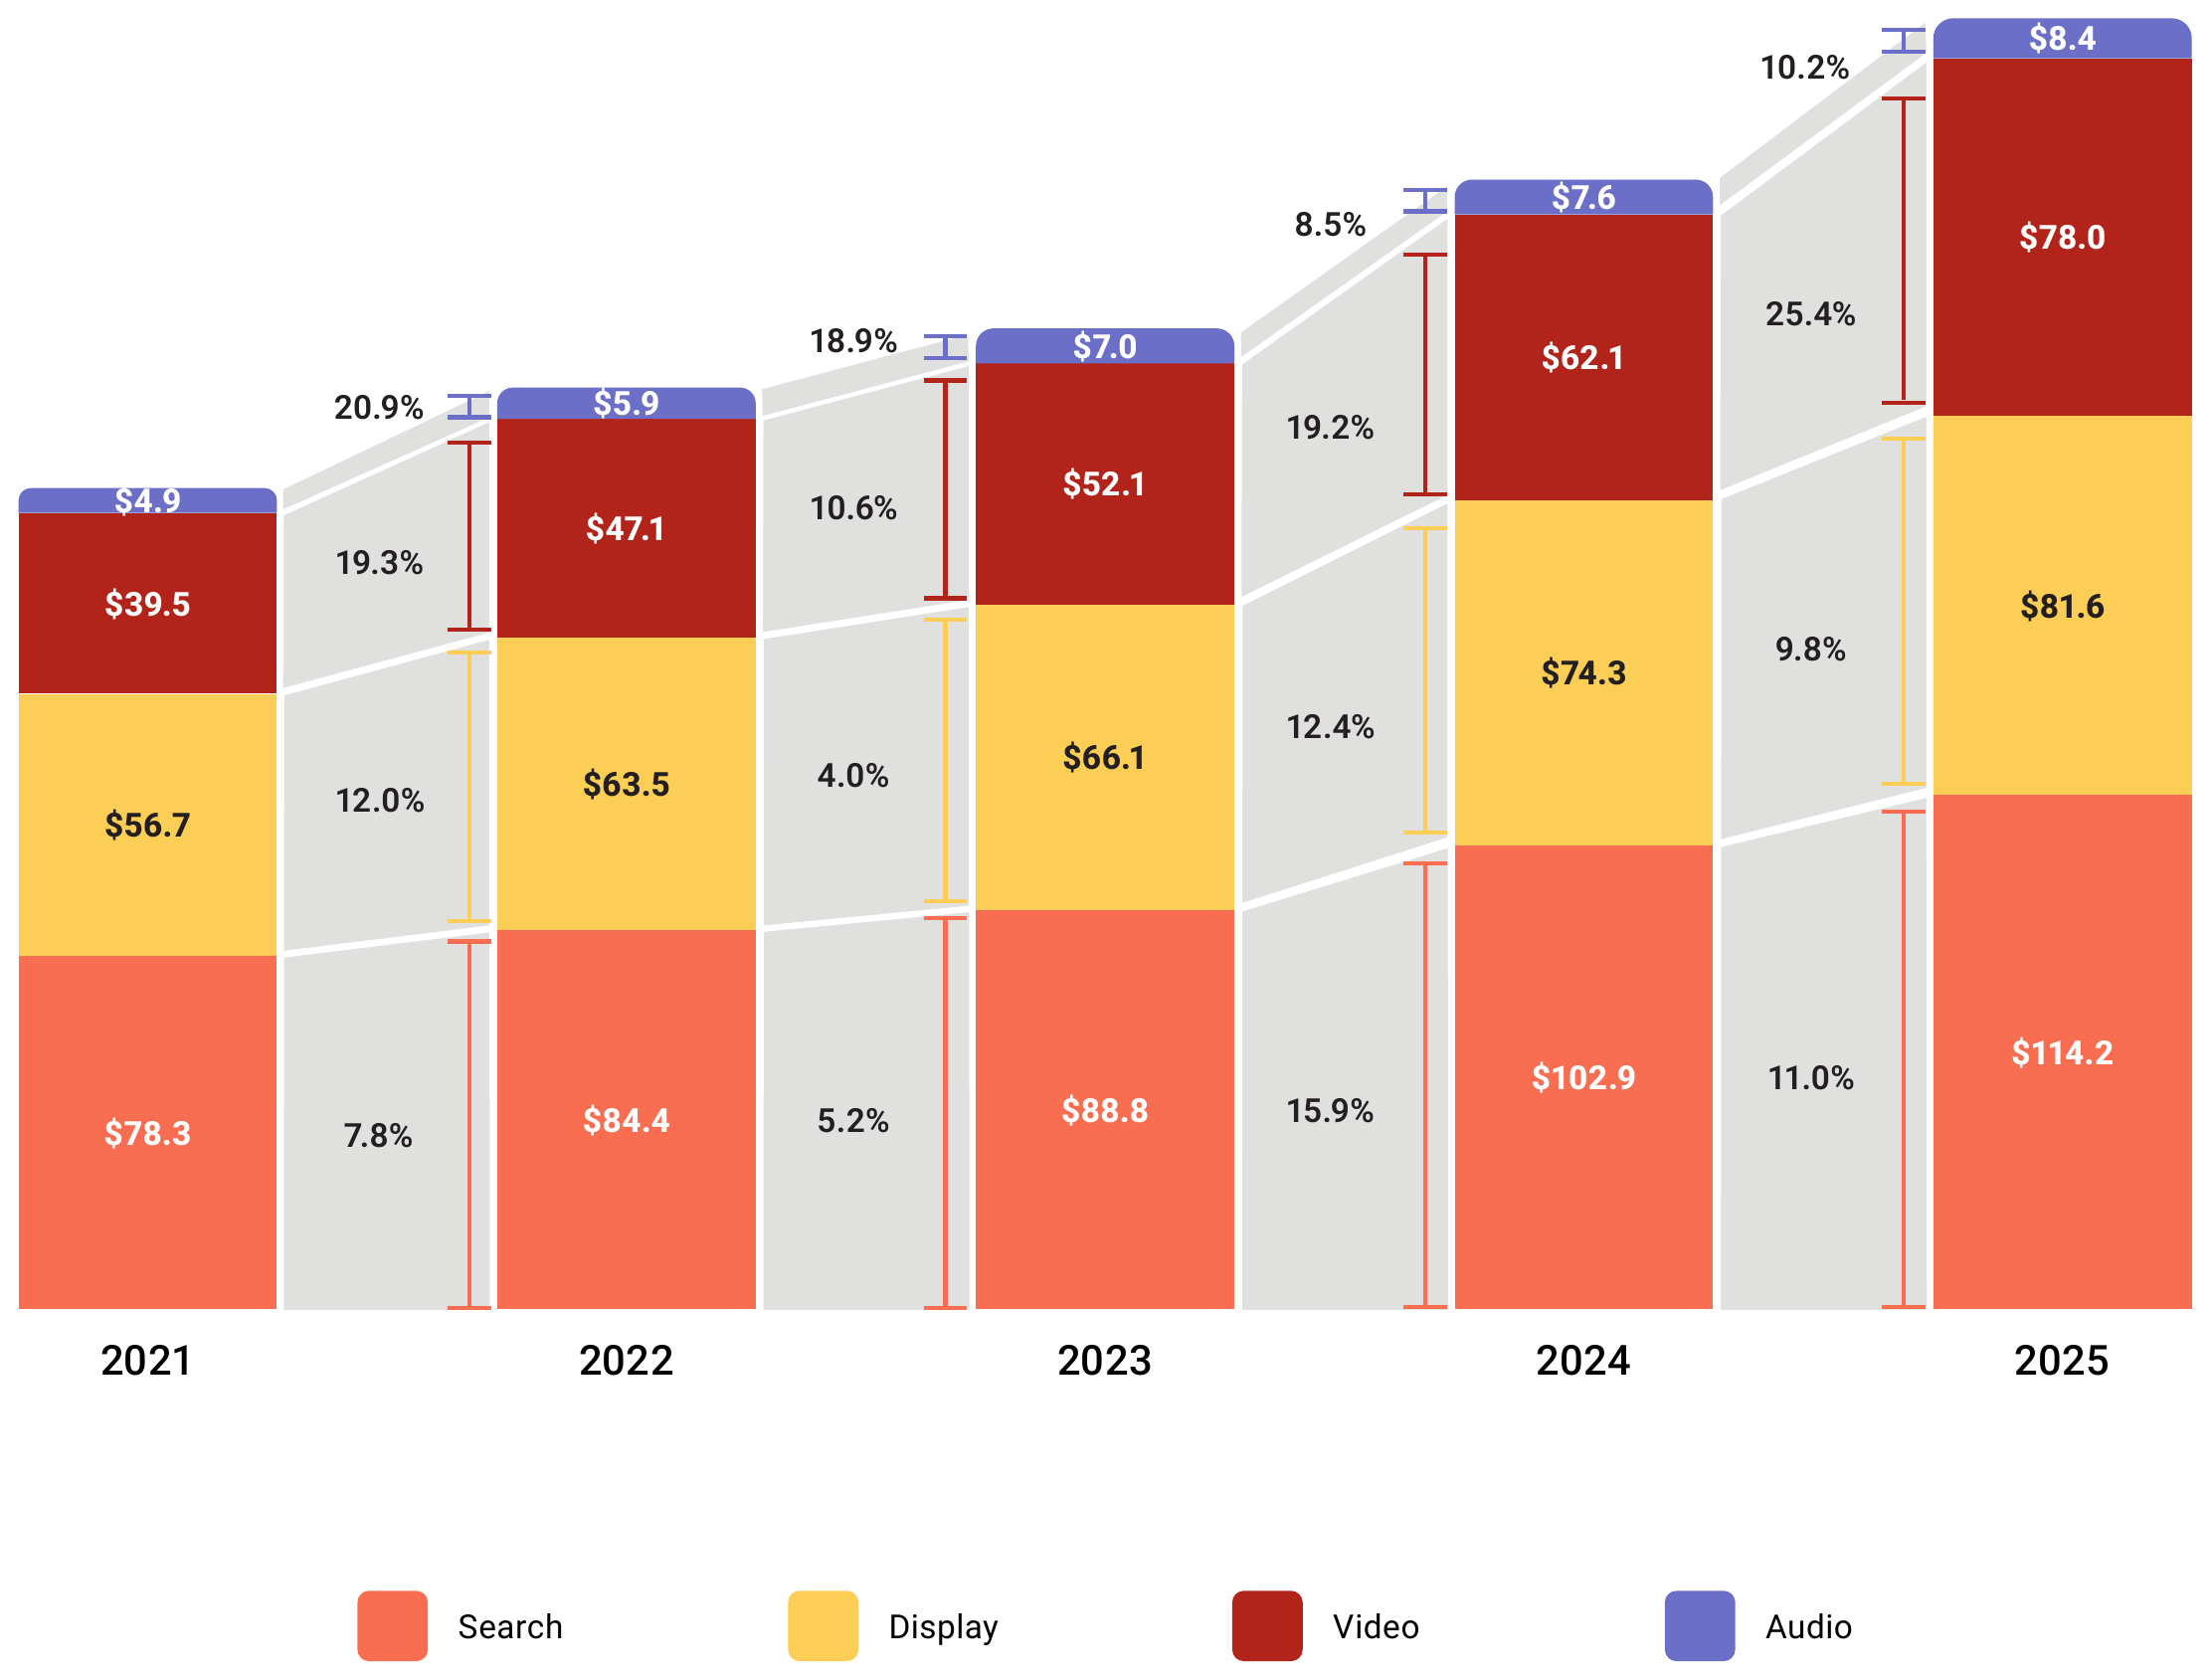
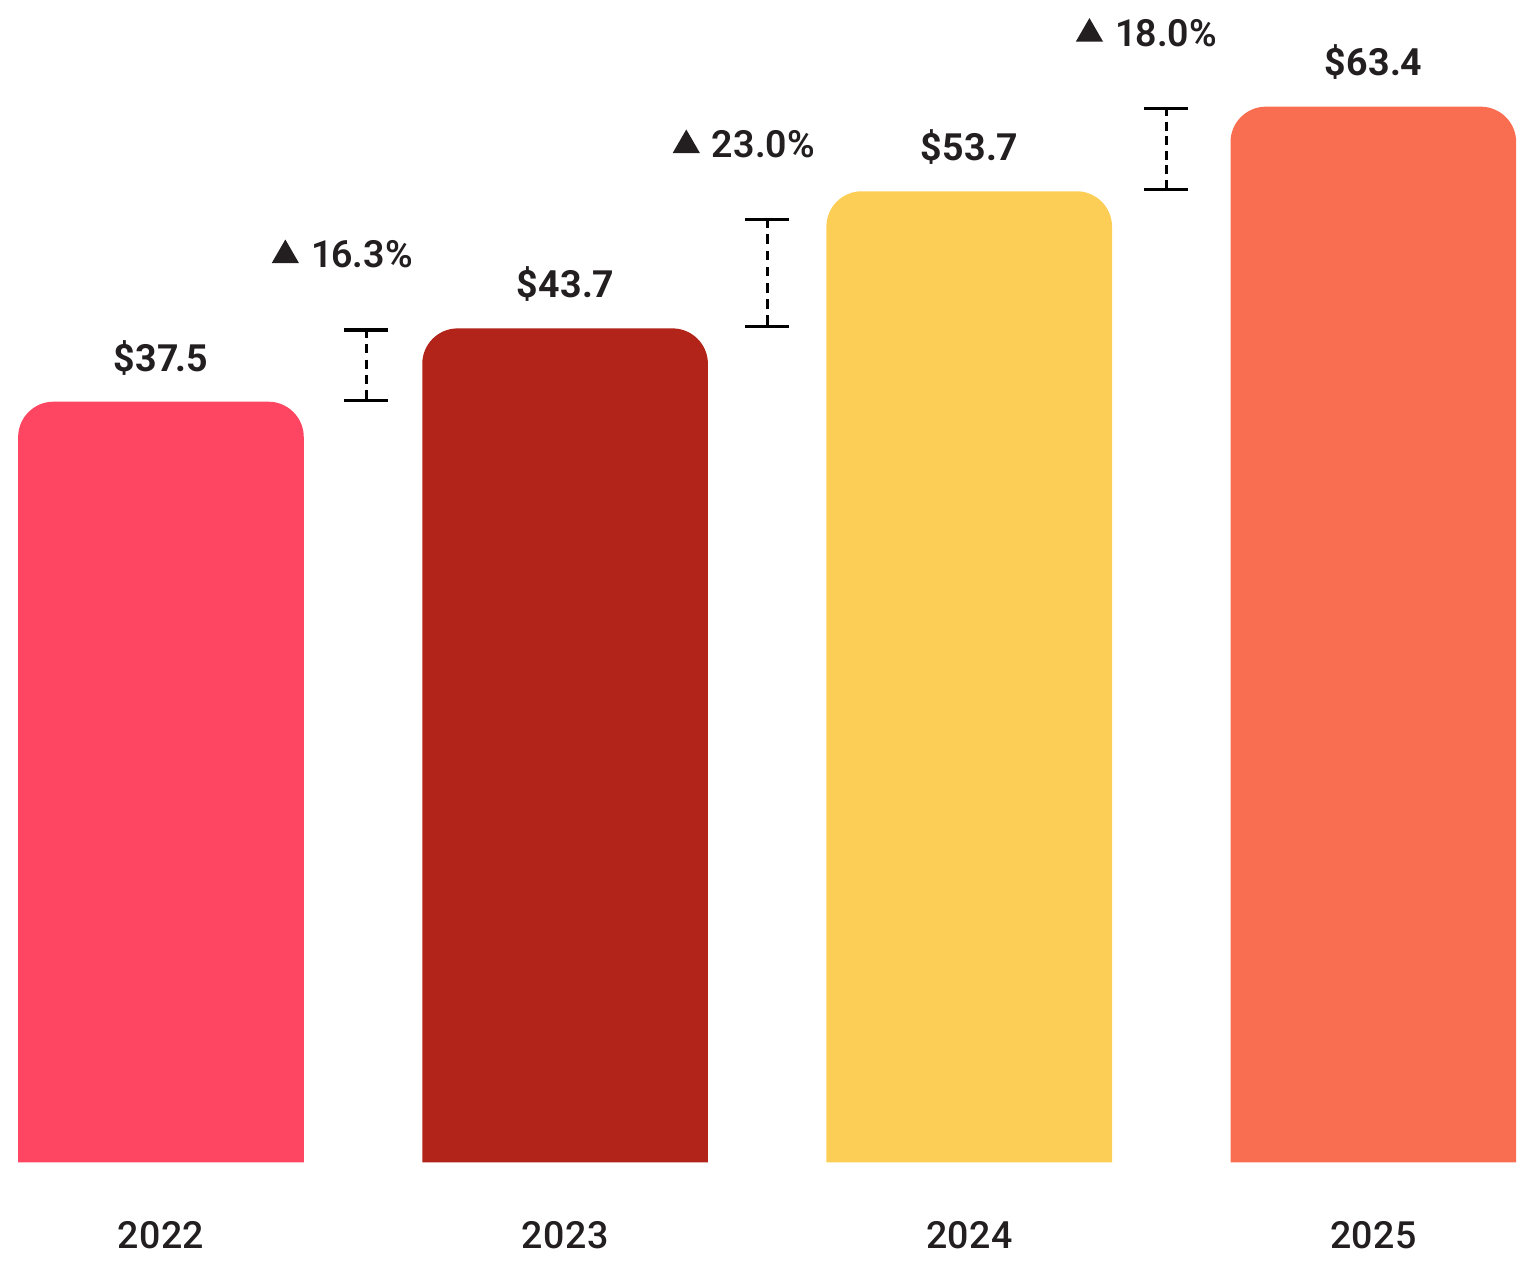
Online Ad Revenues, 2021-2025
Large Ad Seller Revenues as % of US GDP, 2011-2025
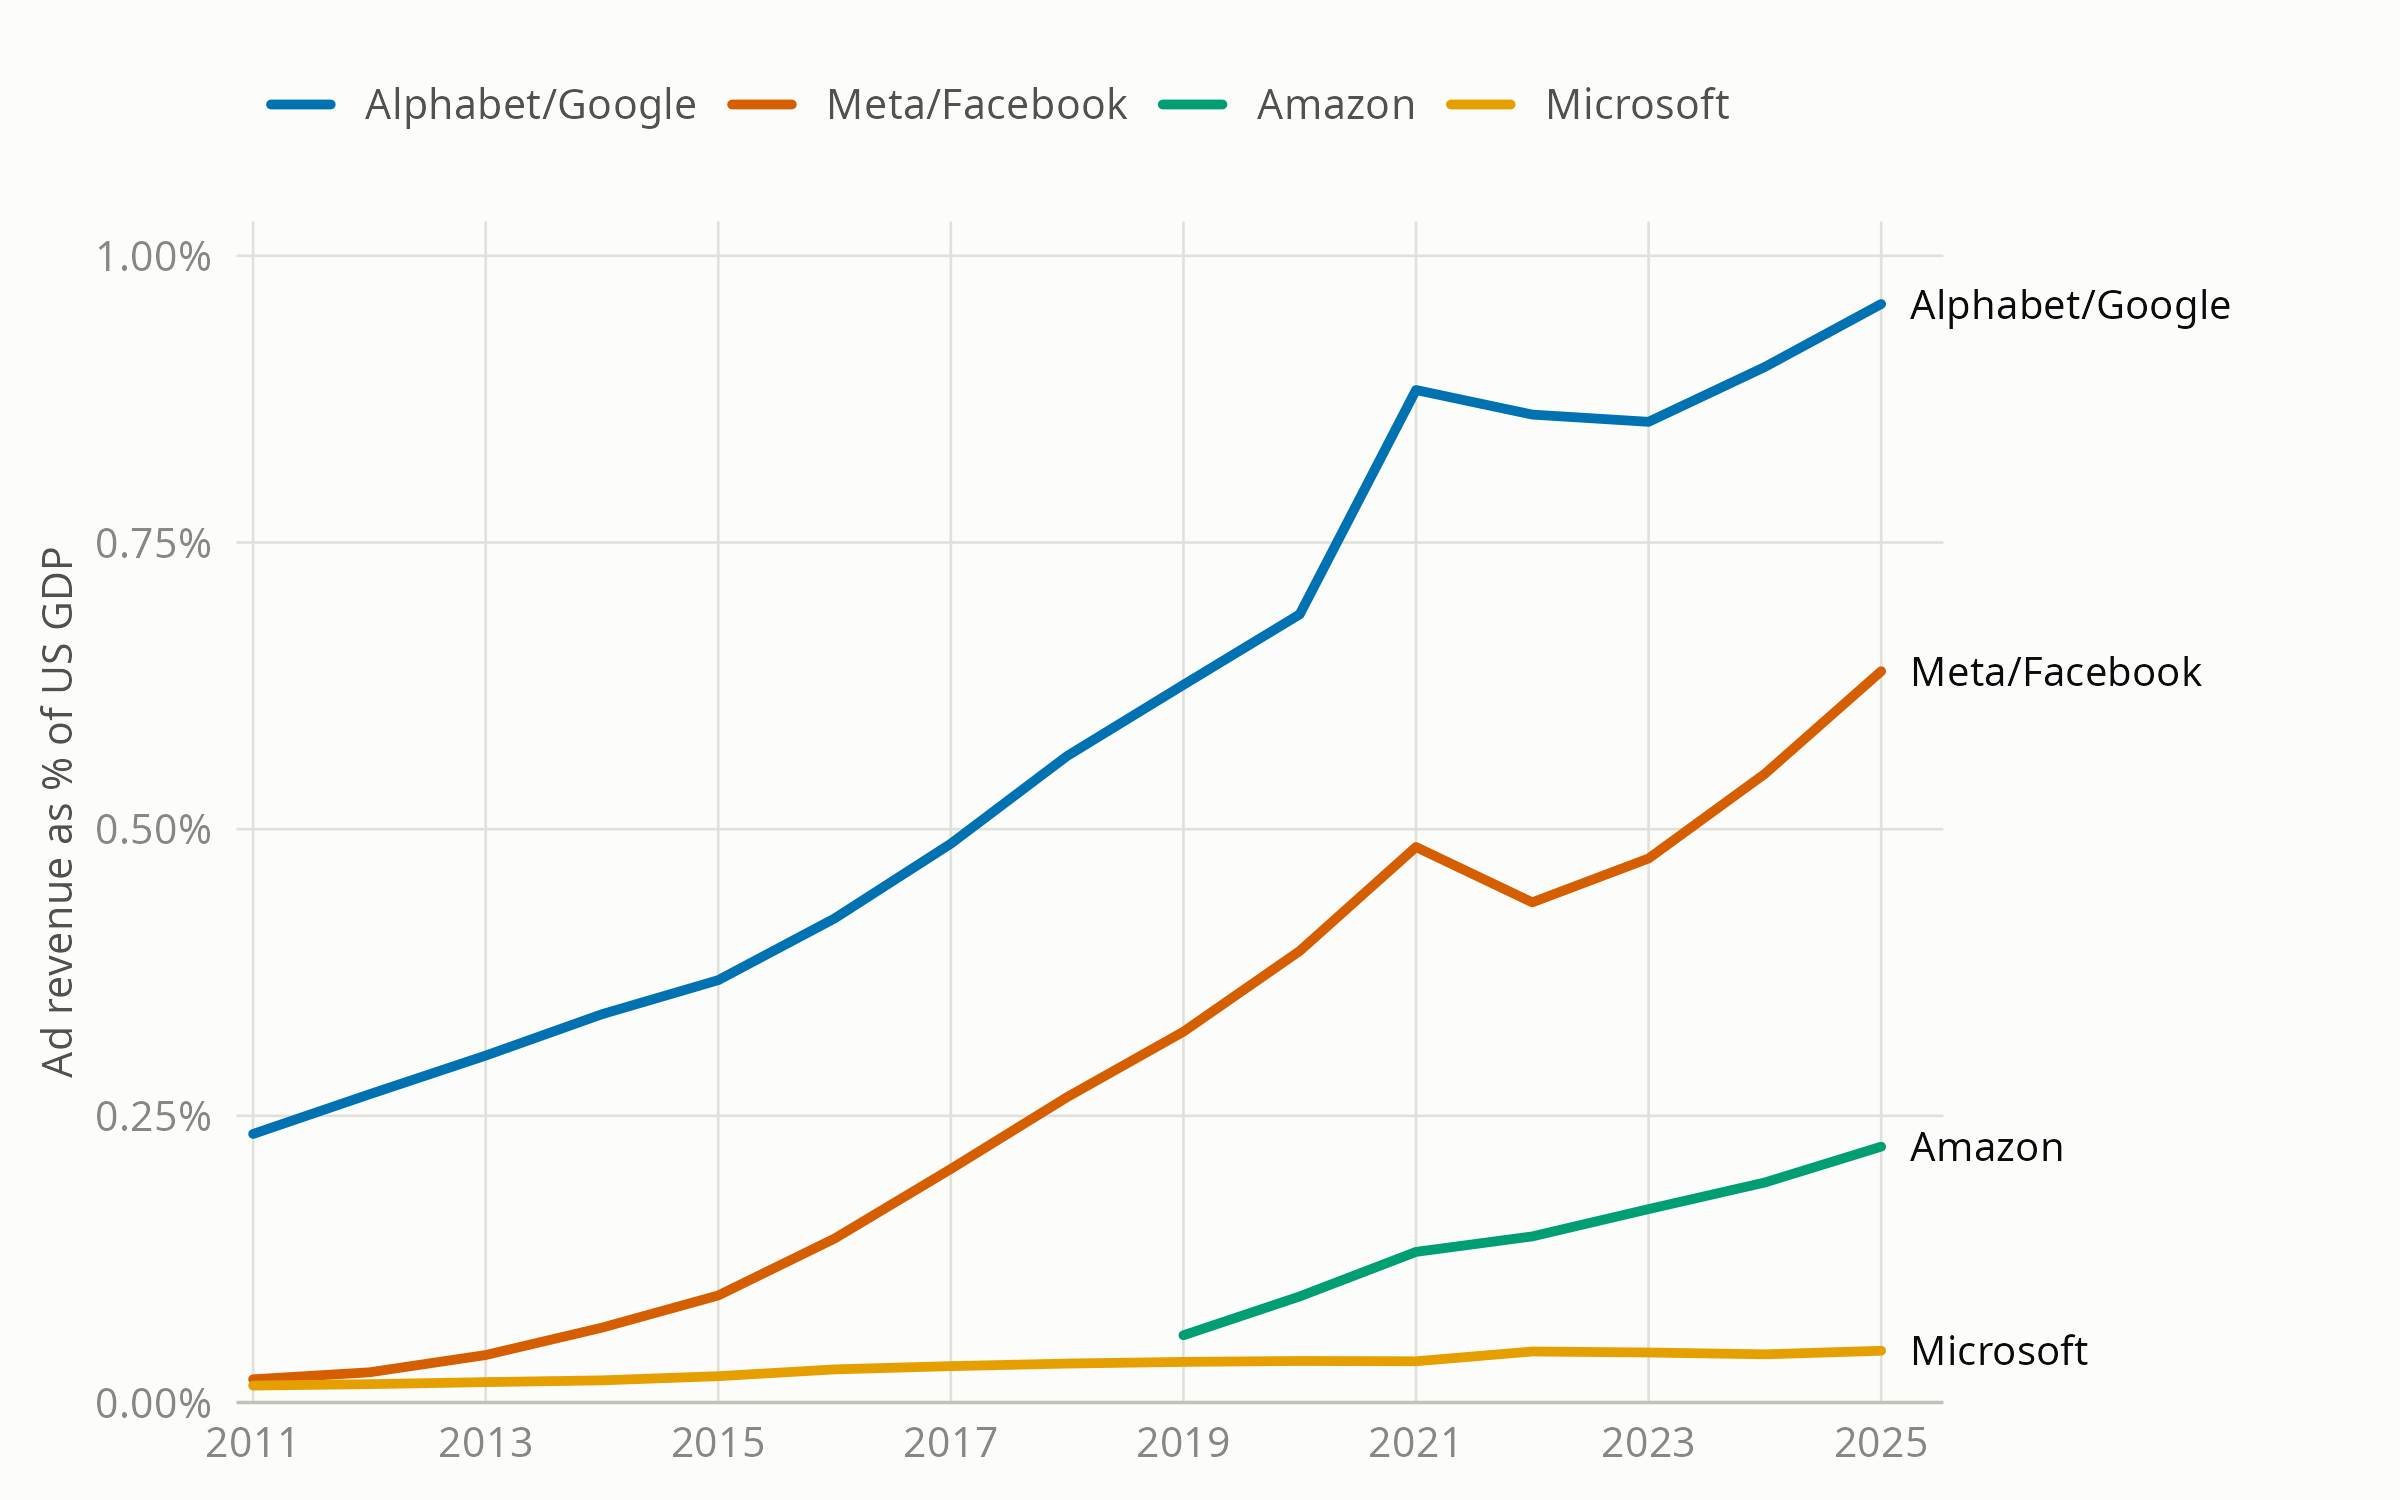
Data: company 10-K filings; BEA NIPA Table 1.1.5. Chart concept: Marto and Le (2024)
Large Ad Seller Profit Percentage, 2011-2025
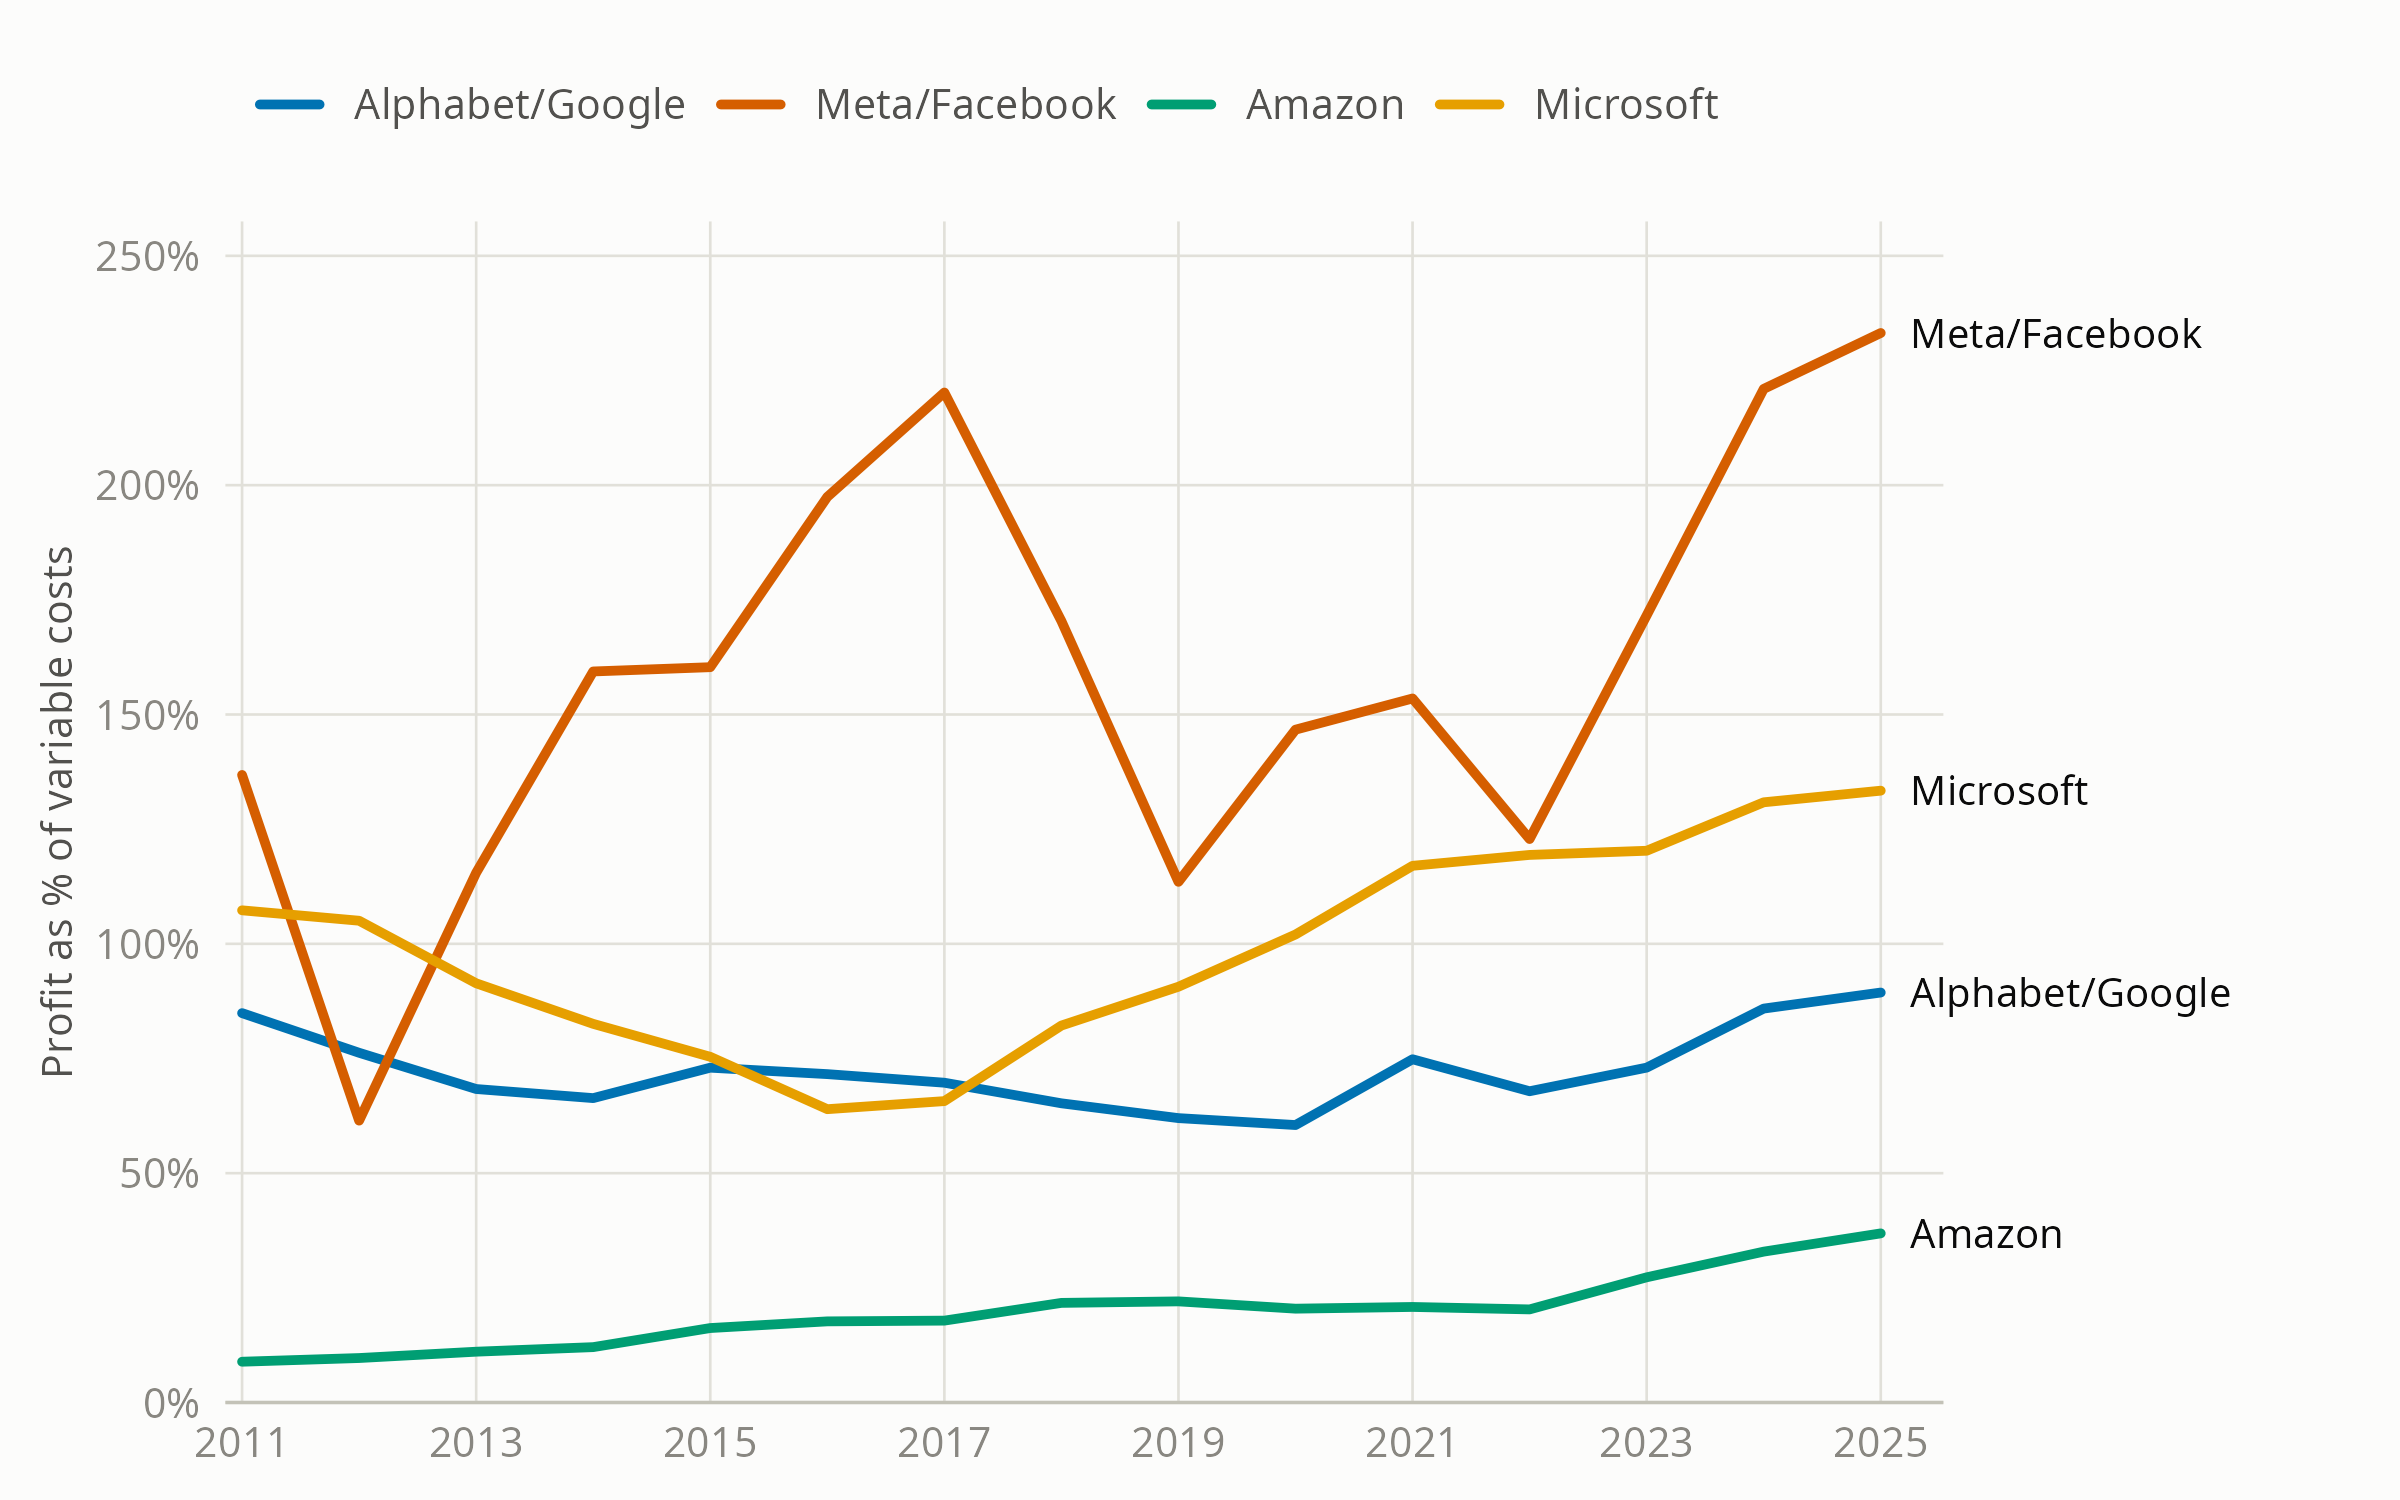
Data: company 10-K filings. Chart concept: Marto and Le (2024)
Right ad, right person, right context, right time?
- Imagine you’re selling mortgages. Mortgage lenders offer numerous loans at distinct price points. Yet 78% of consumers say they only apply to a single lender/broker for a quote (FHFA 2024), and most borrowers actively seek a loan for only a few days or less
- To advertise profitably, you may need to find people who
- Can qualify for a loan
- Actively want to buy a new home
- Are thinking about the finance process
- Have not signed a loan yet
- Predicting which consumers to reach is necessary but insufficient. You also have to identify the brief window of time when an ad might shift each borrower’s behavior, and reach them in a context where they might act on your message

AI Trades Online Ads
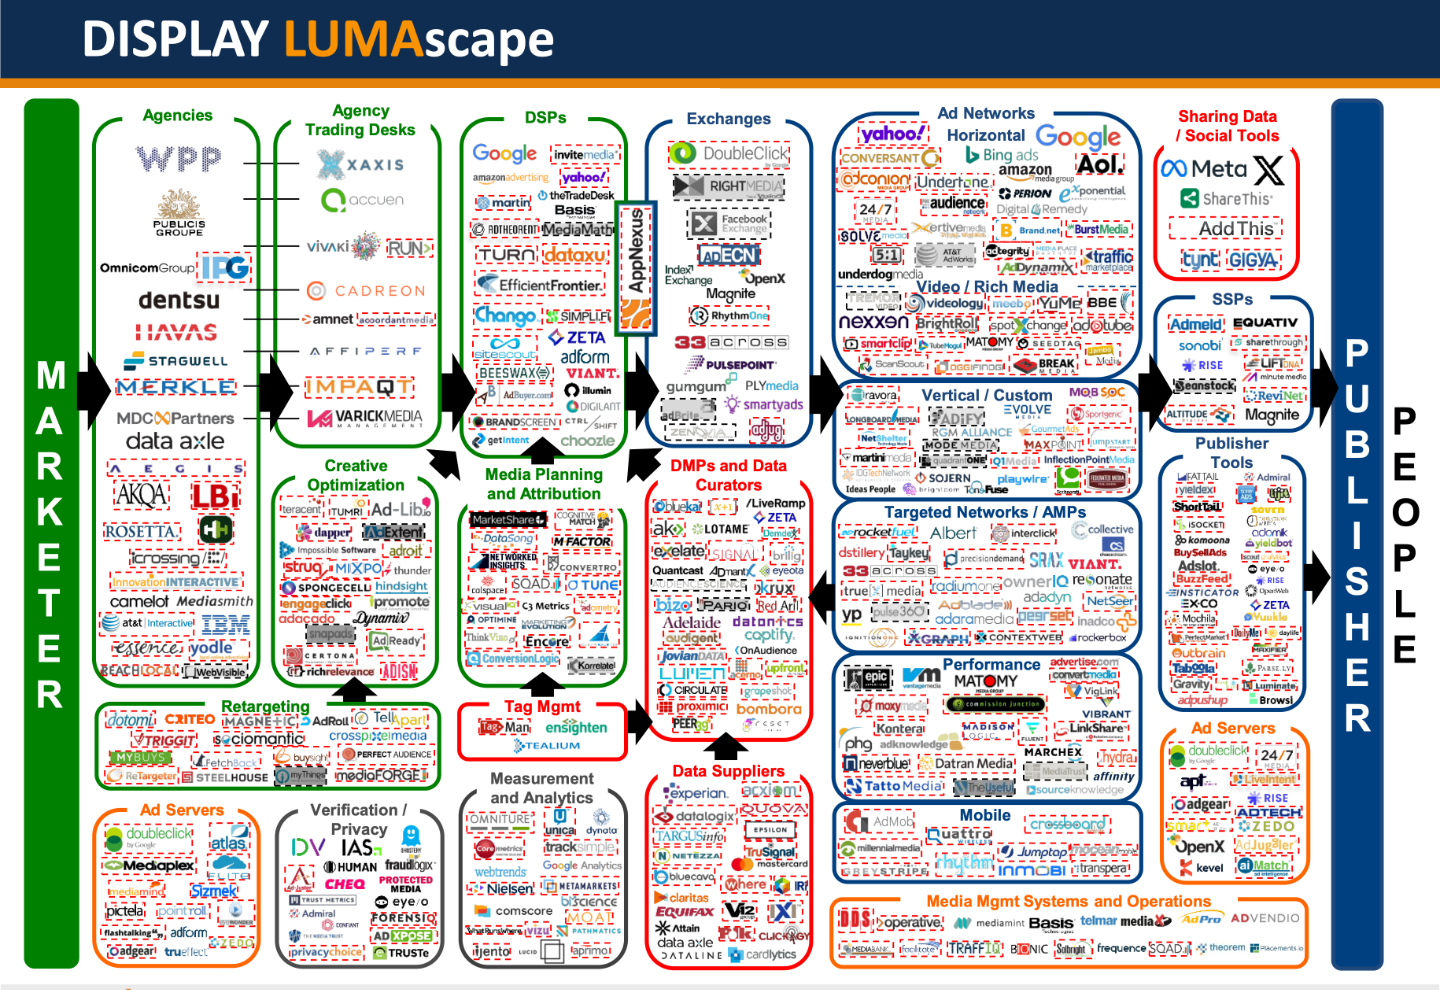
The Ad Tech Ecosystem
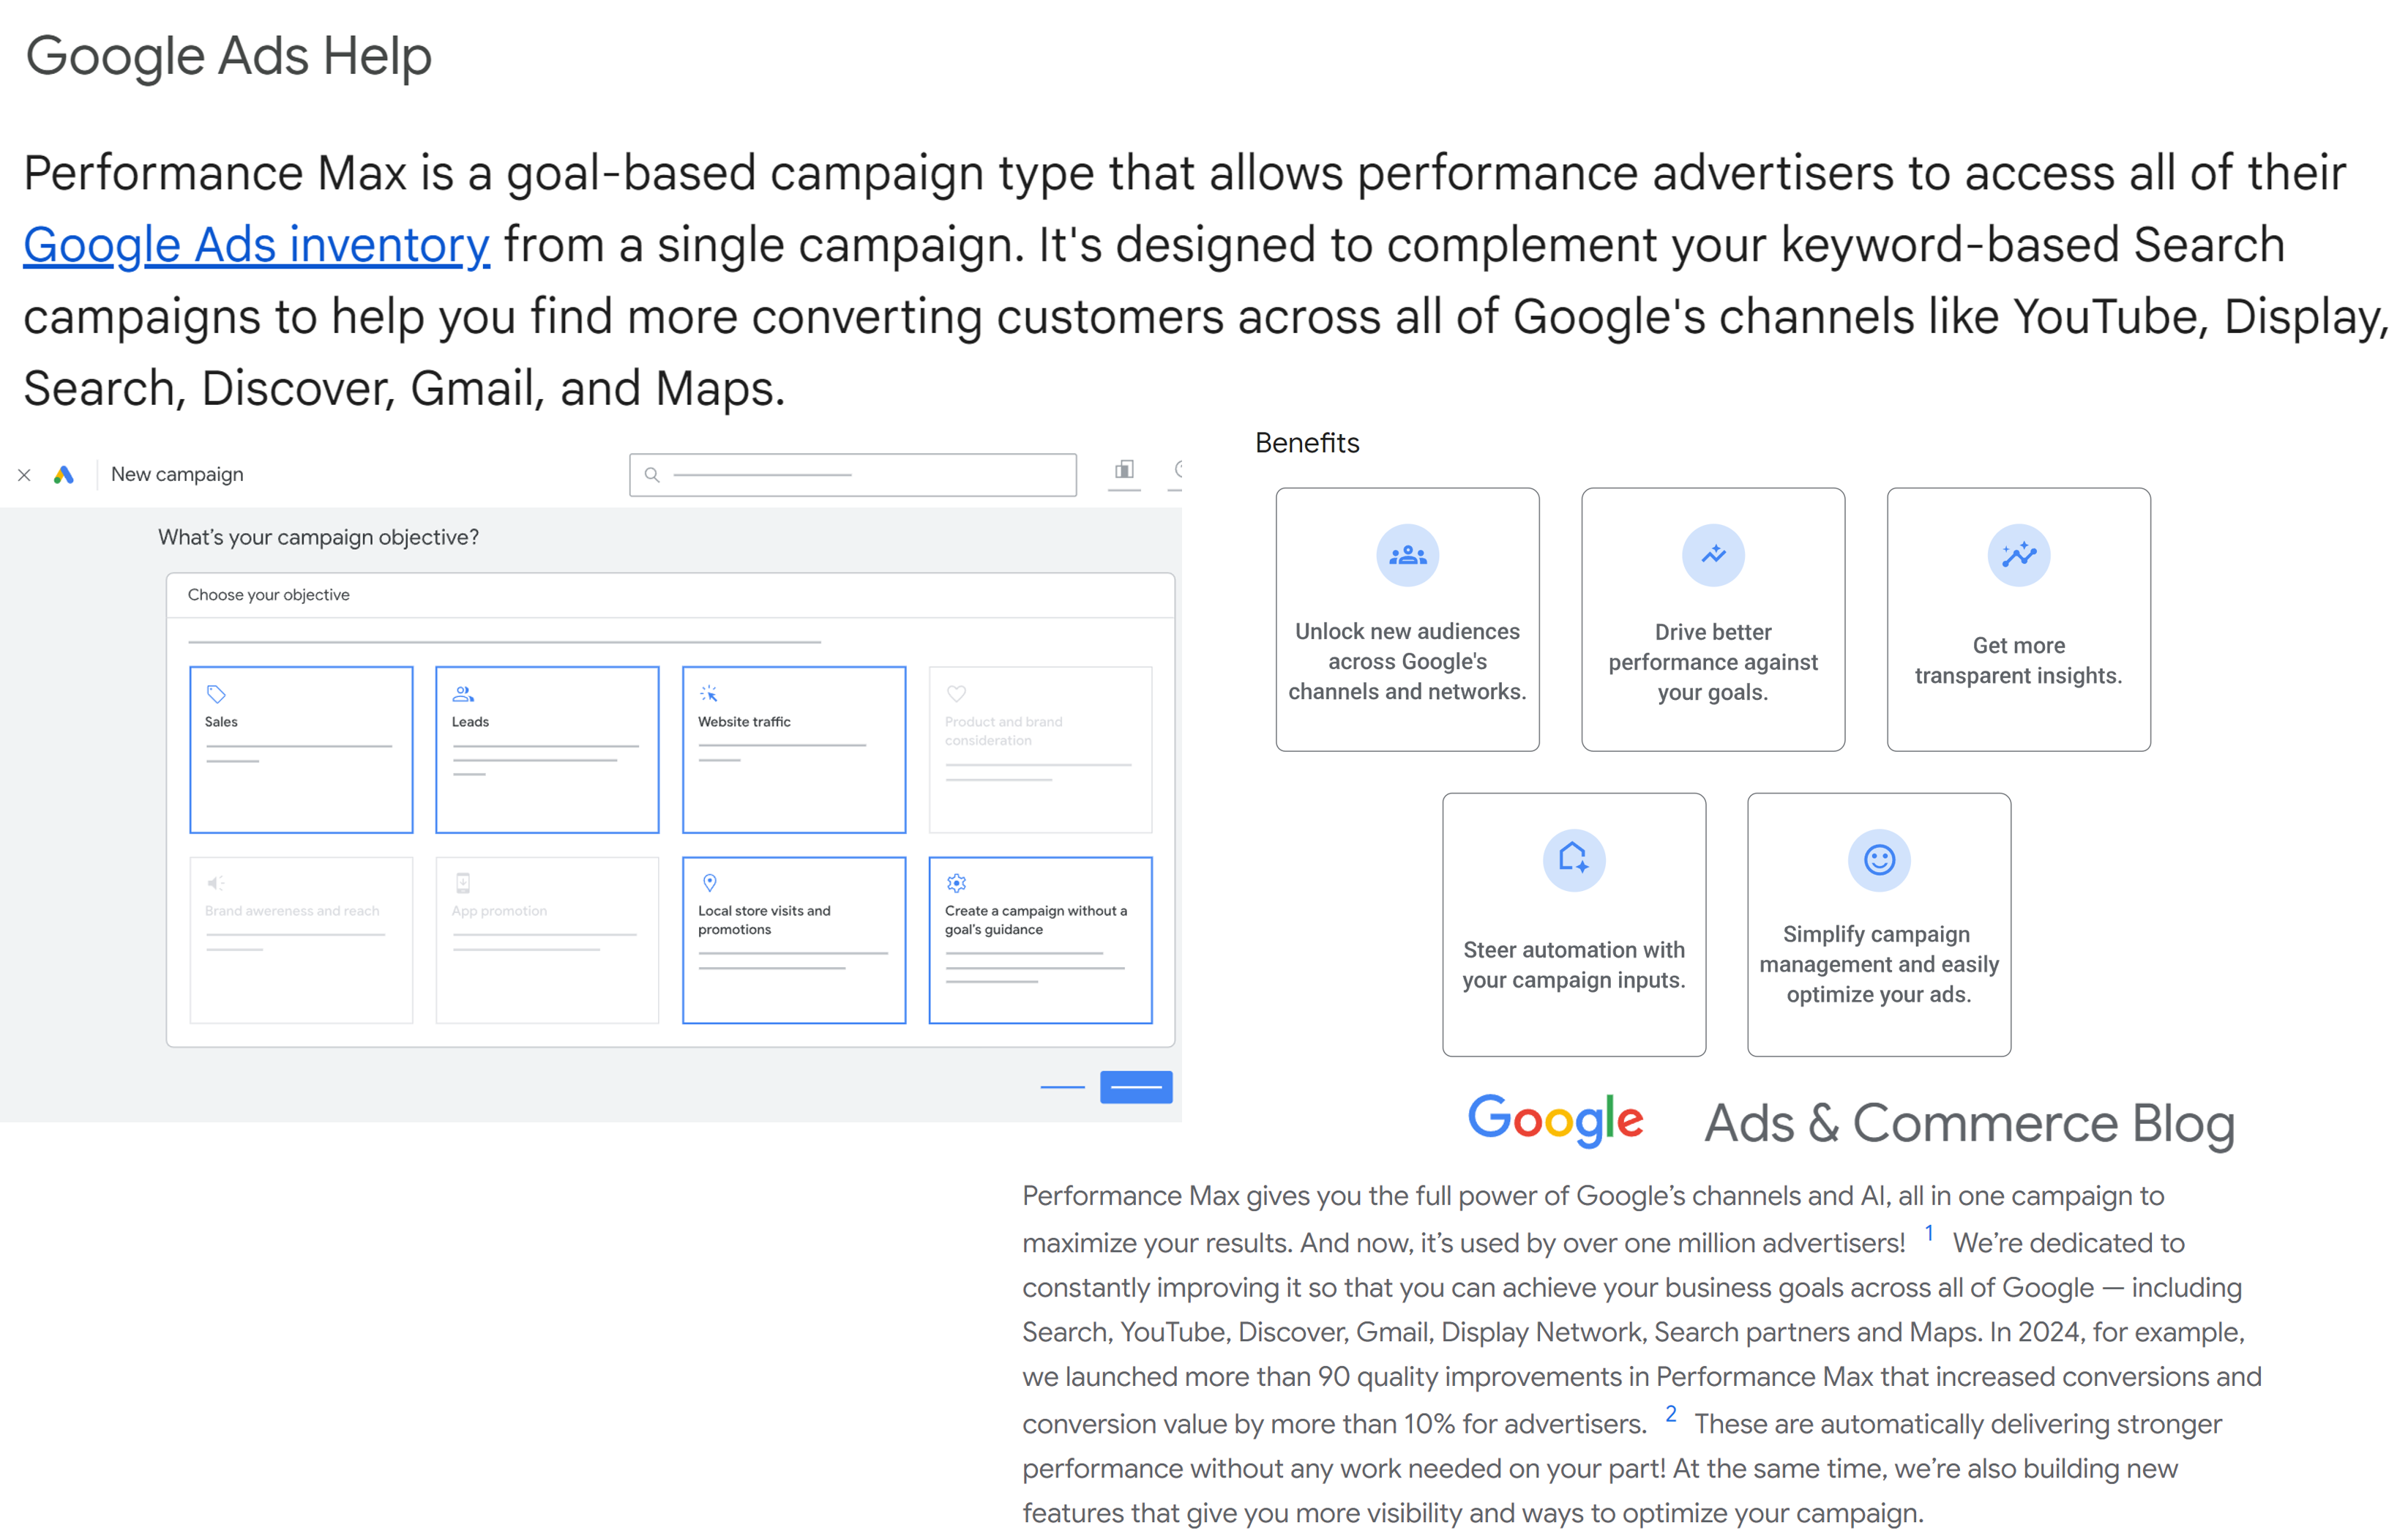
Google Performance Max
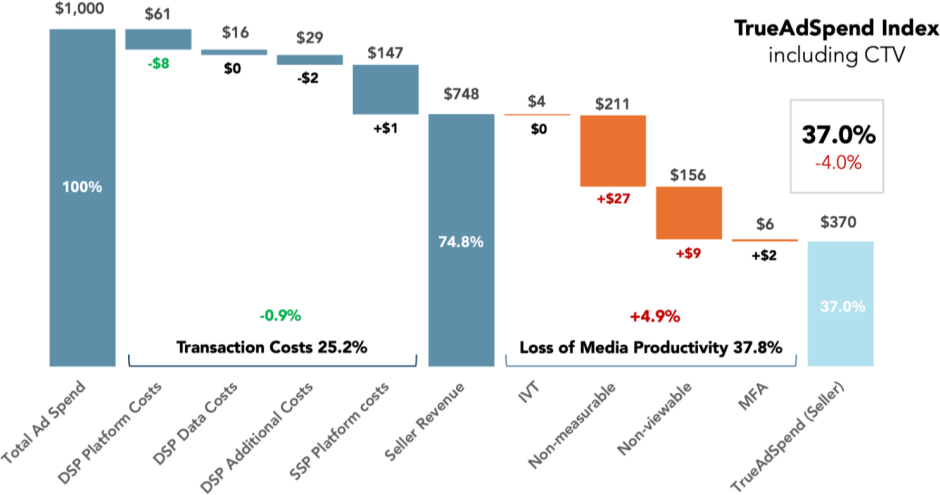
The “Ad Tech Tax”
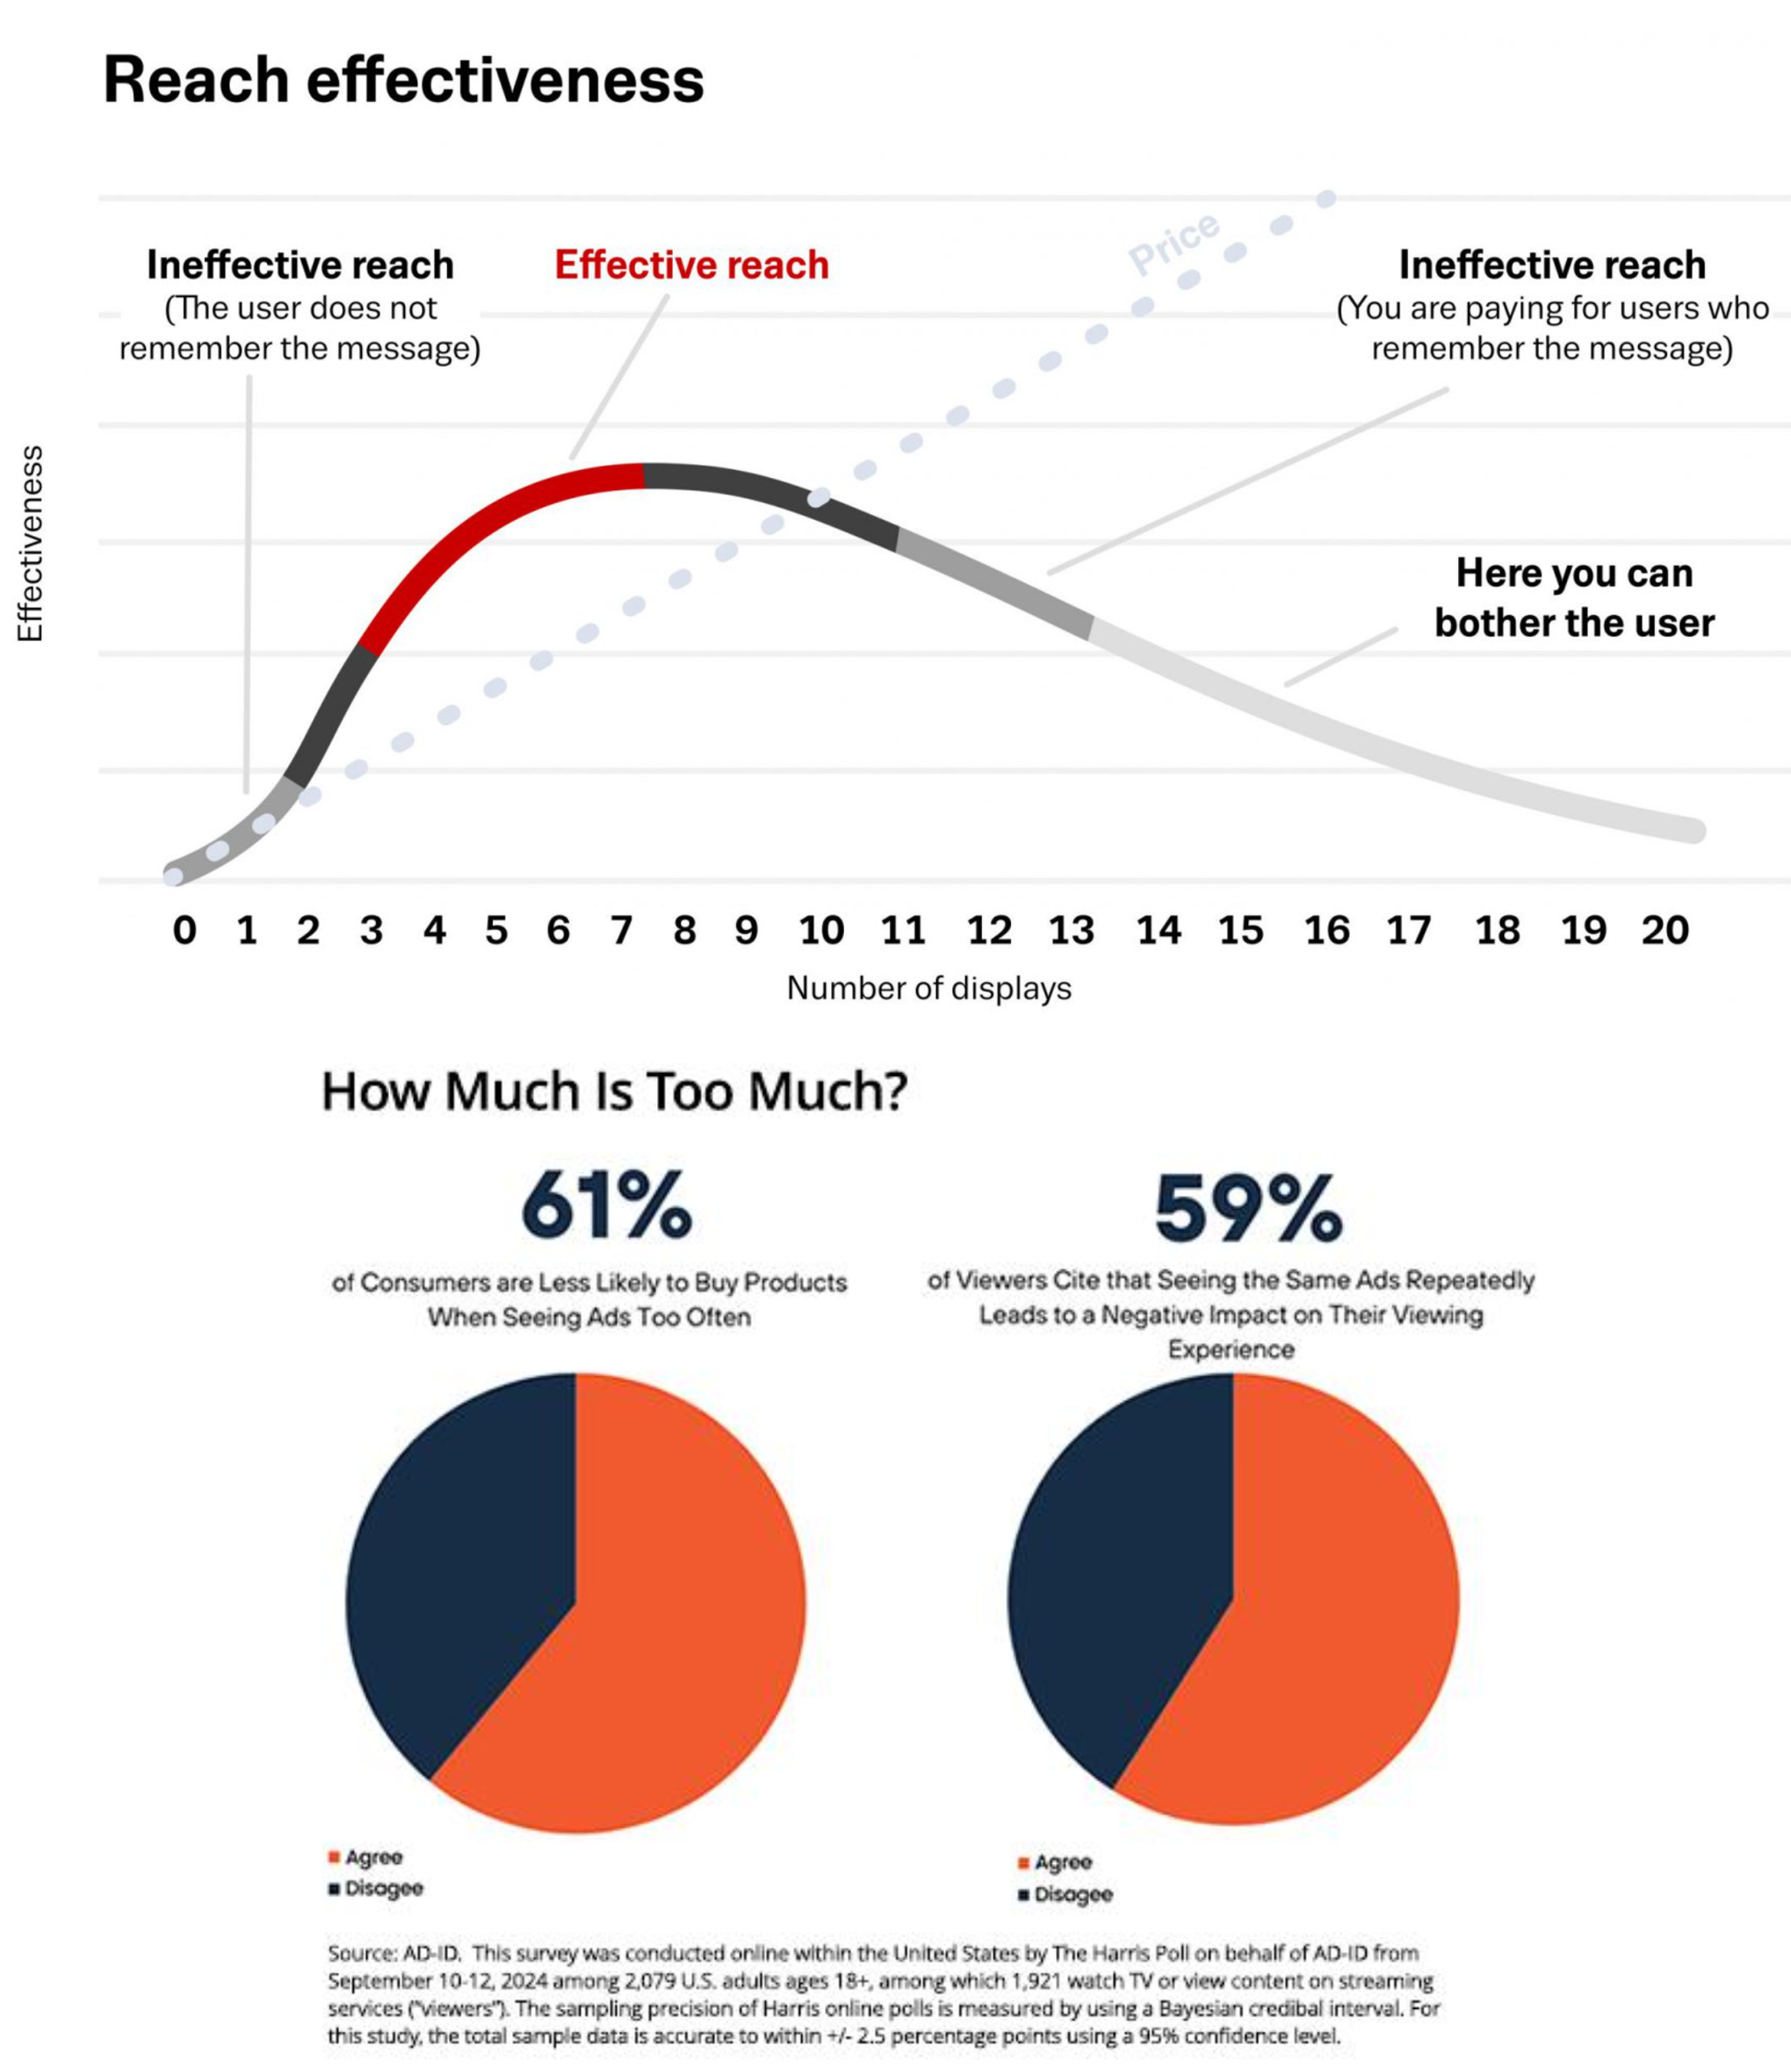
Effective Frequency
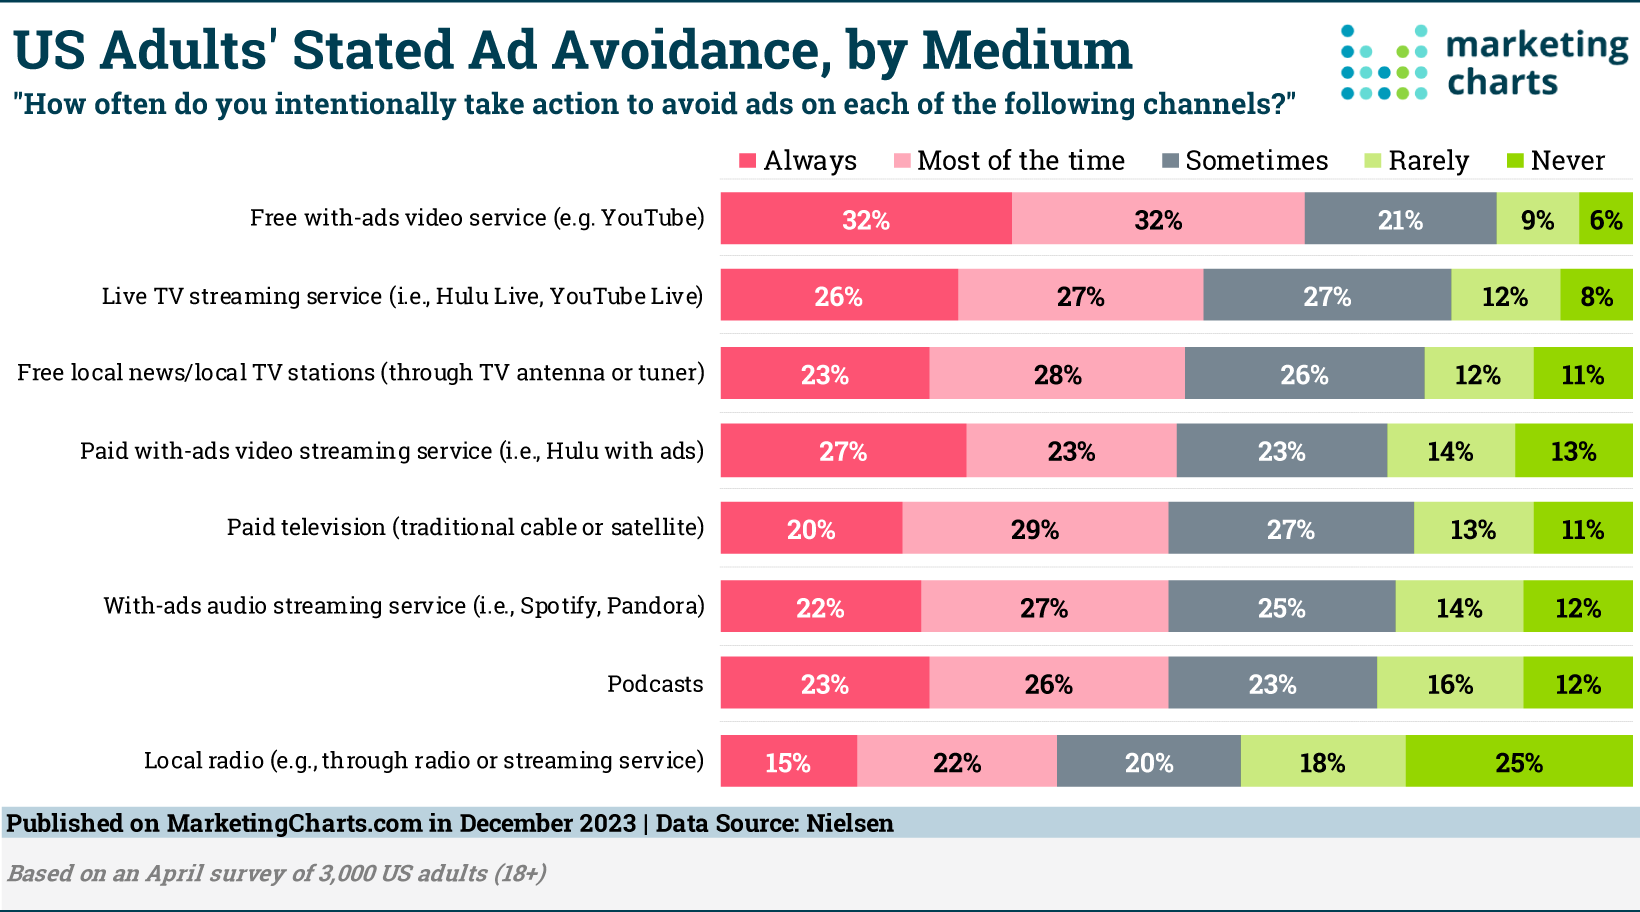
Advertising avoidance
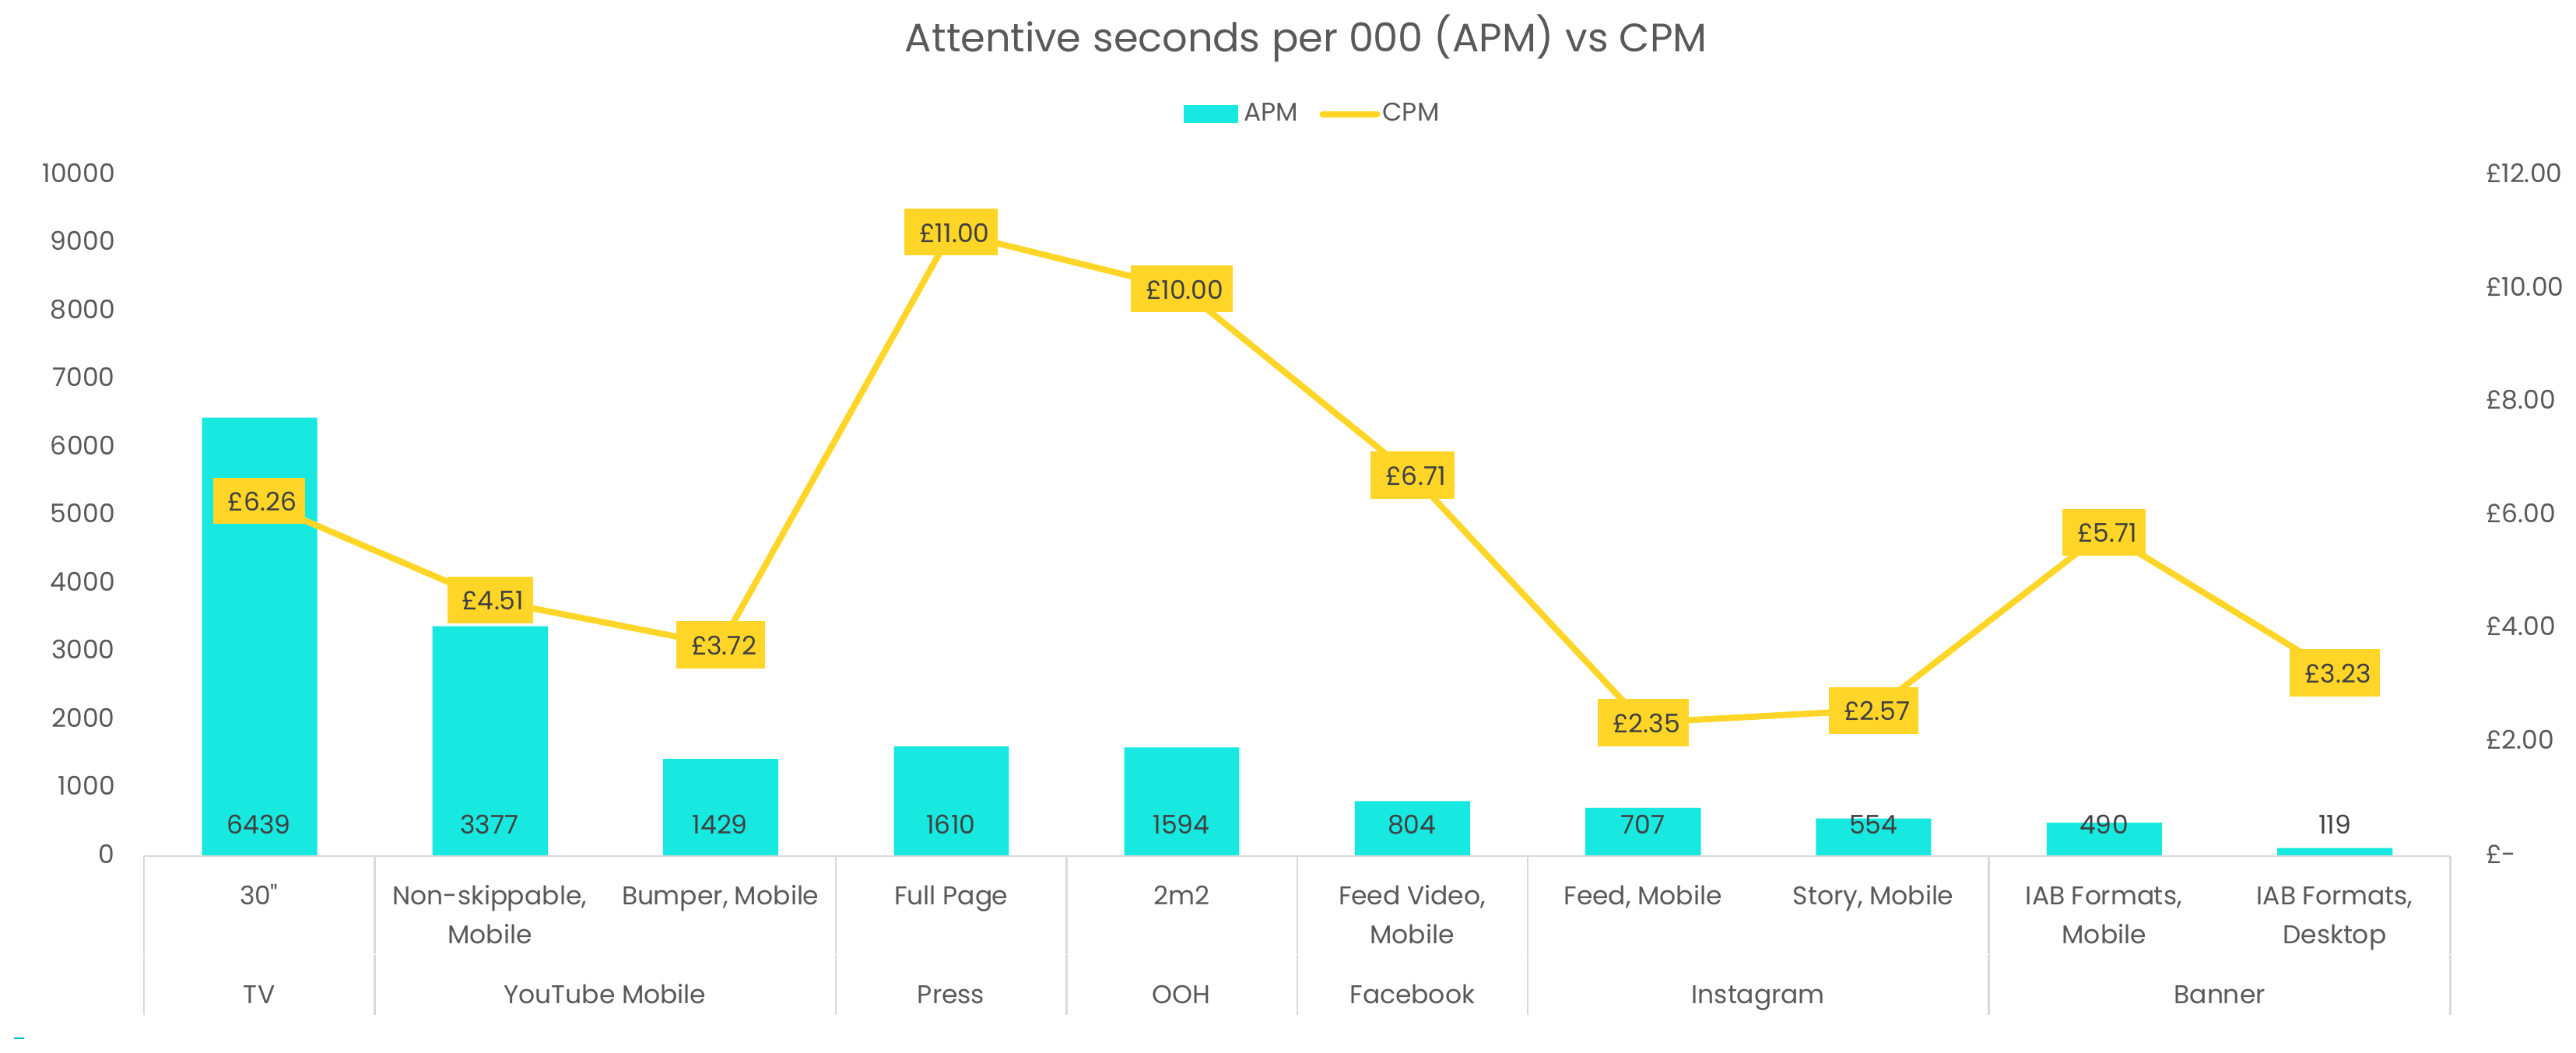
Consumer Attention by Medium

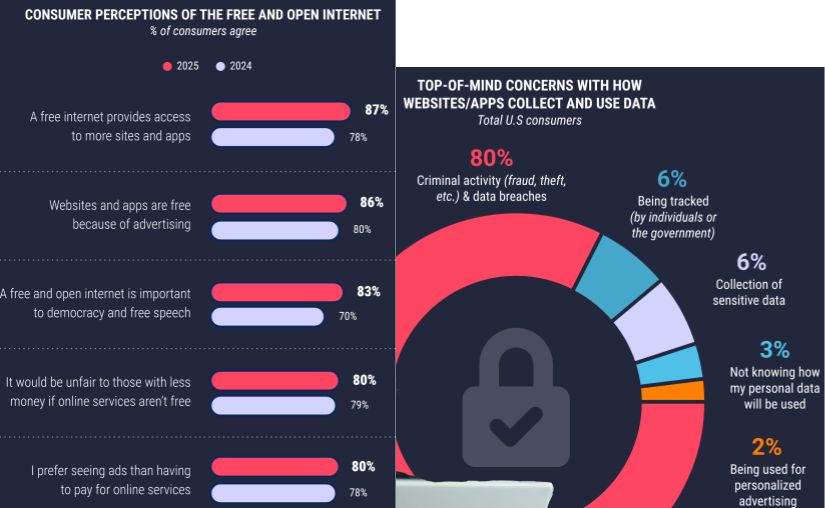
Privacy Perceptions
Commerce Media
Brand Safety and Suitability
- Brand safety: Protect brands against negative impacts on consumer opinion from ads appearing near specific types of content
- E.g., proximate to military conflict, obscenity, drugs, hate speech
- Keyword blacklists and whitelists determine contextual ad bids; blacklists demonetized >50% of Reuters.com news articles
- Ad platforms have seen “advertiser boycotts” demanding content moderation improvements; monetization is expanding recently
- Brand suitability: Identifies brand-aligned content to improve ad delivery
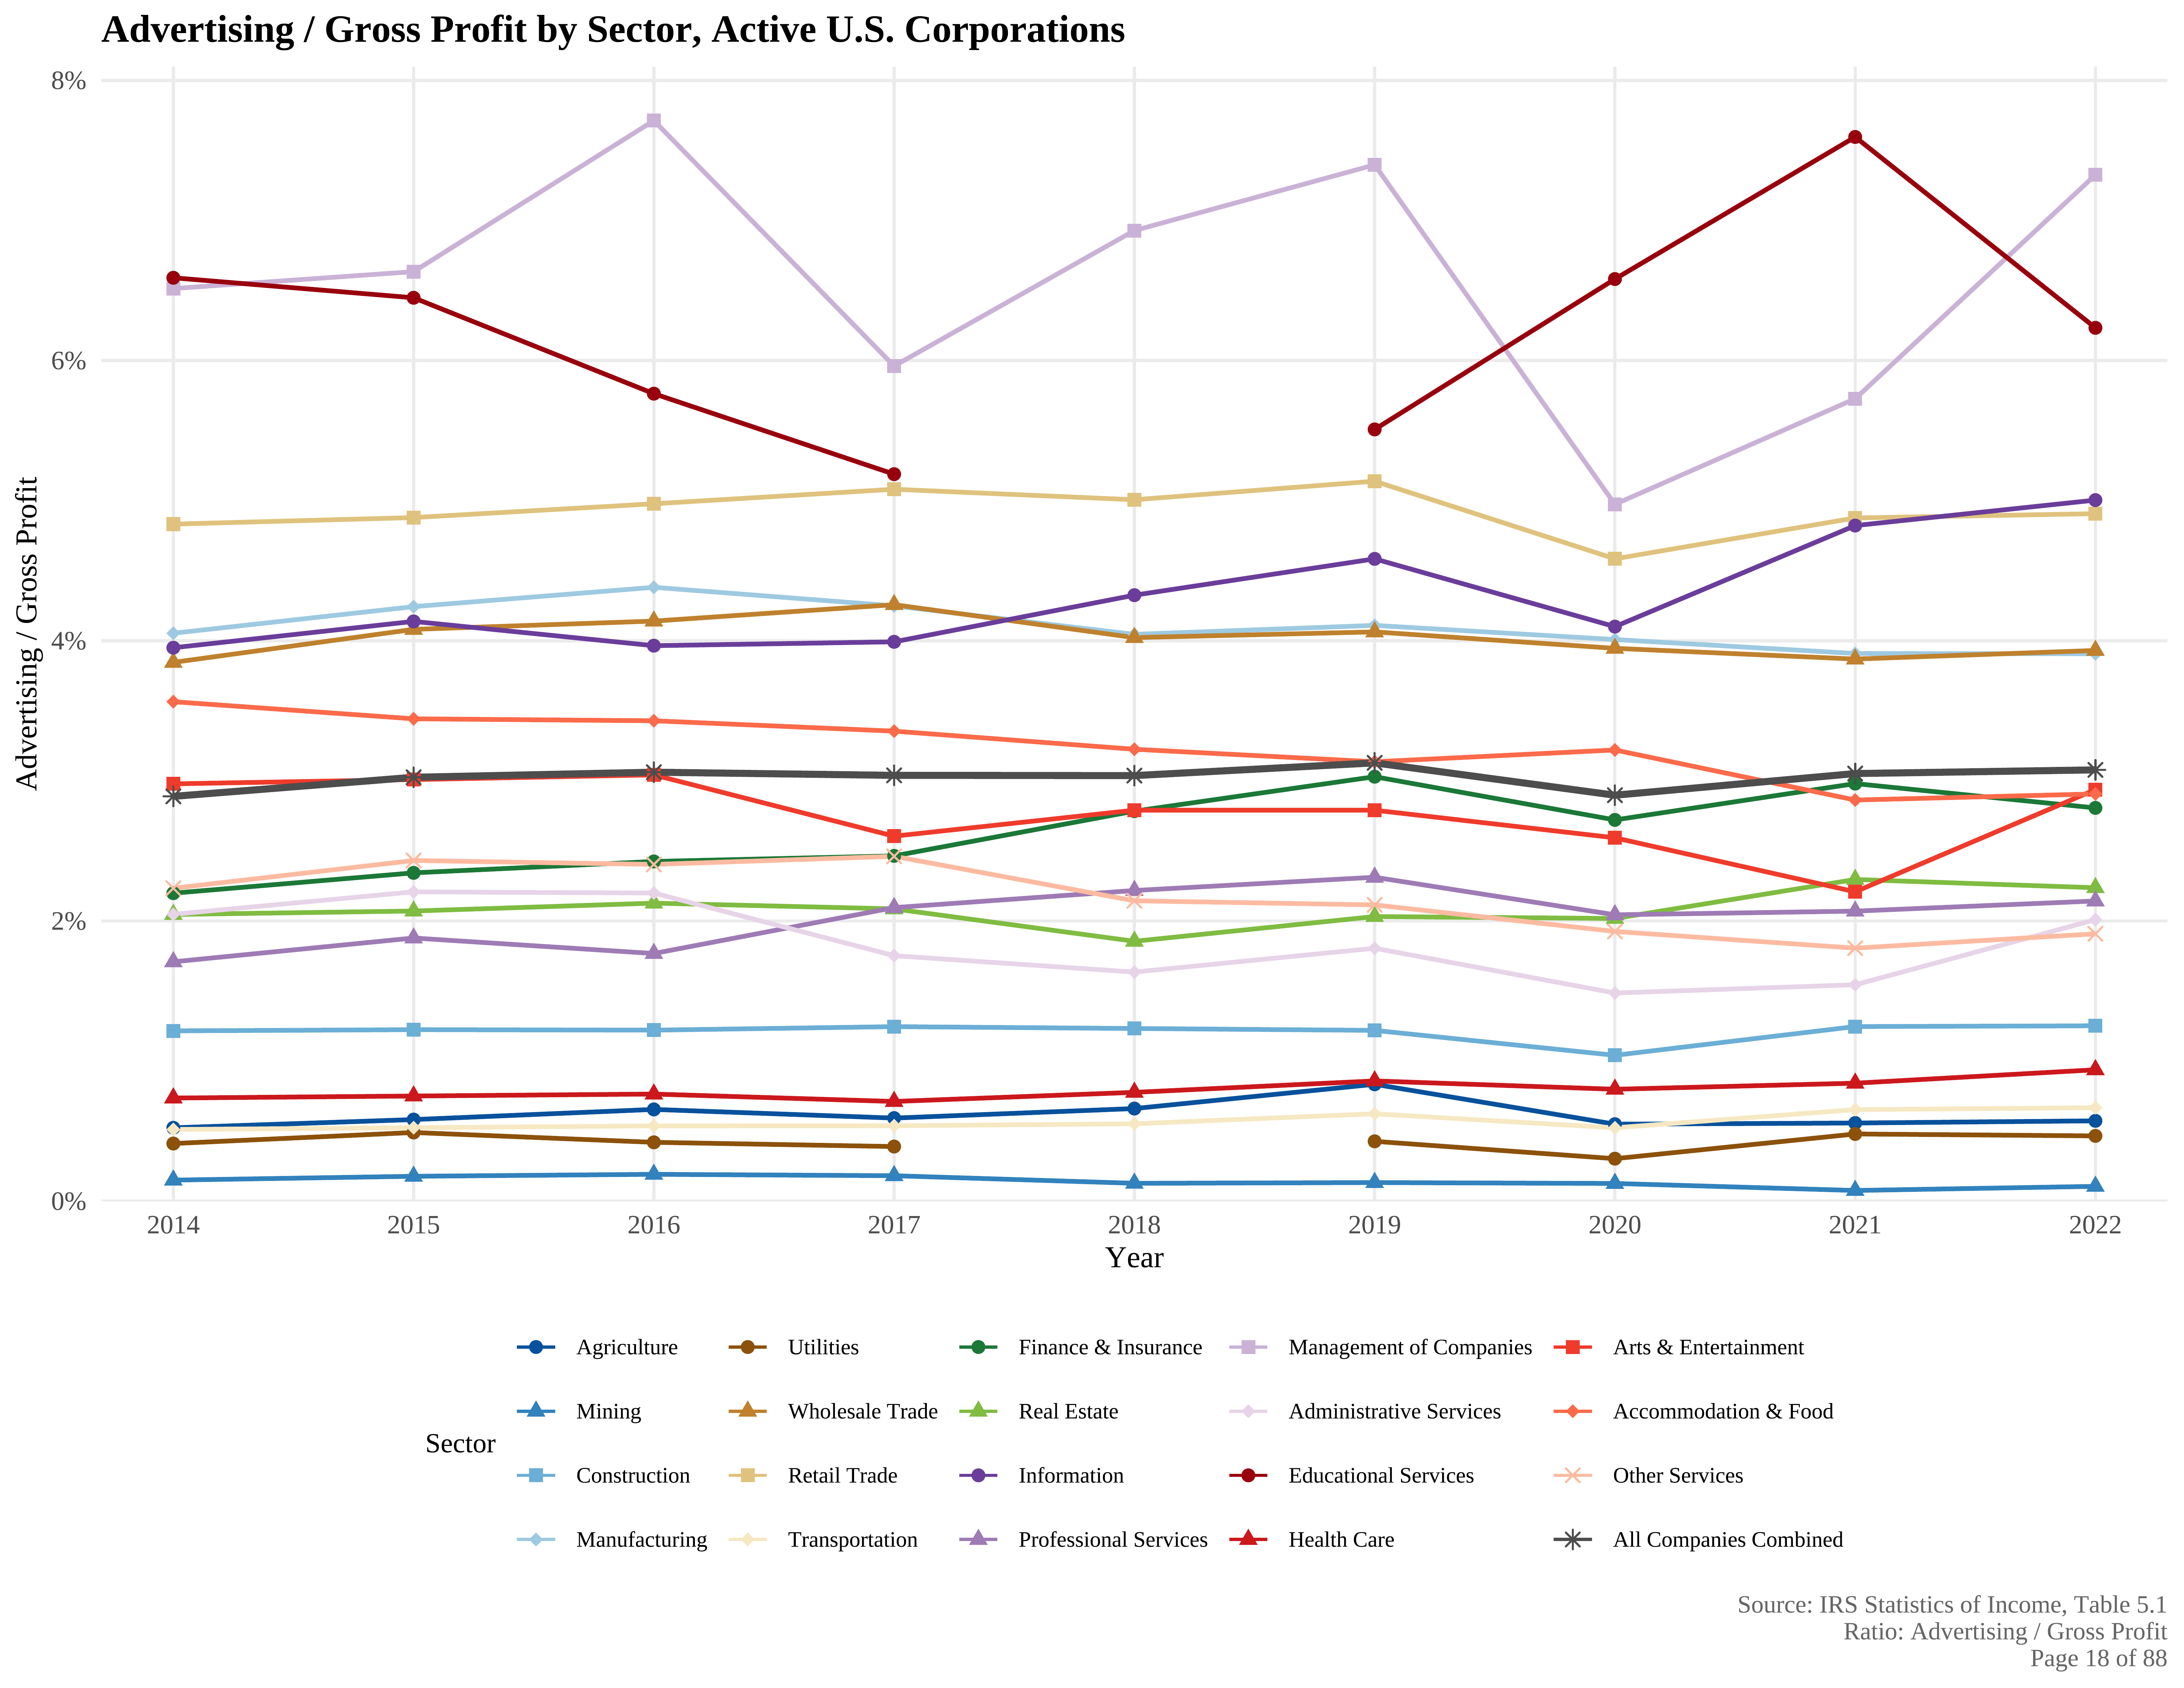
How much do companies spend on Advertising?
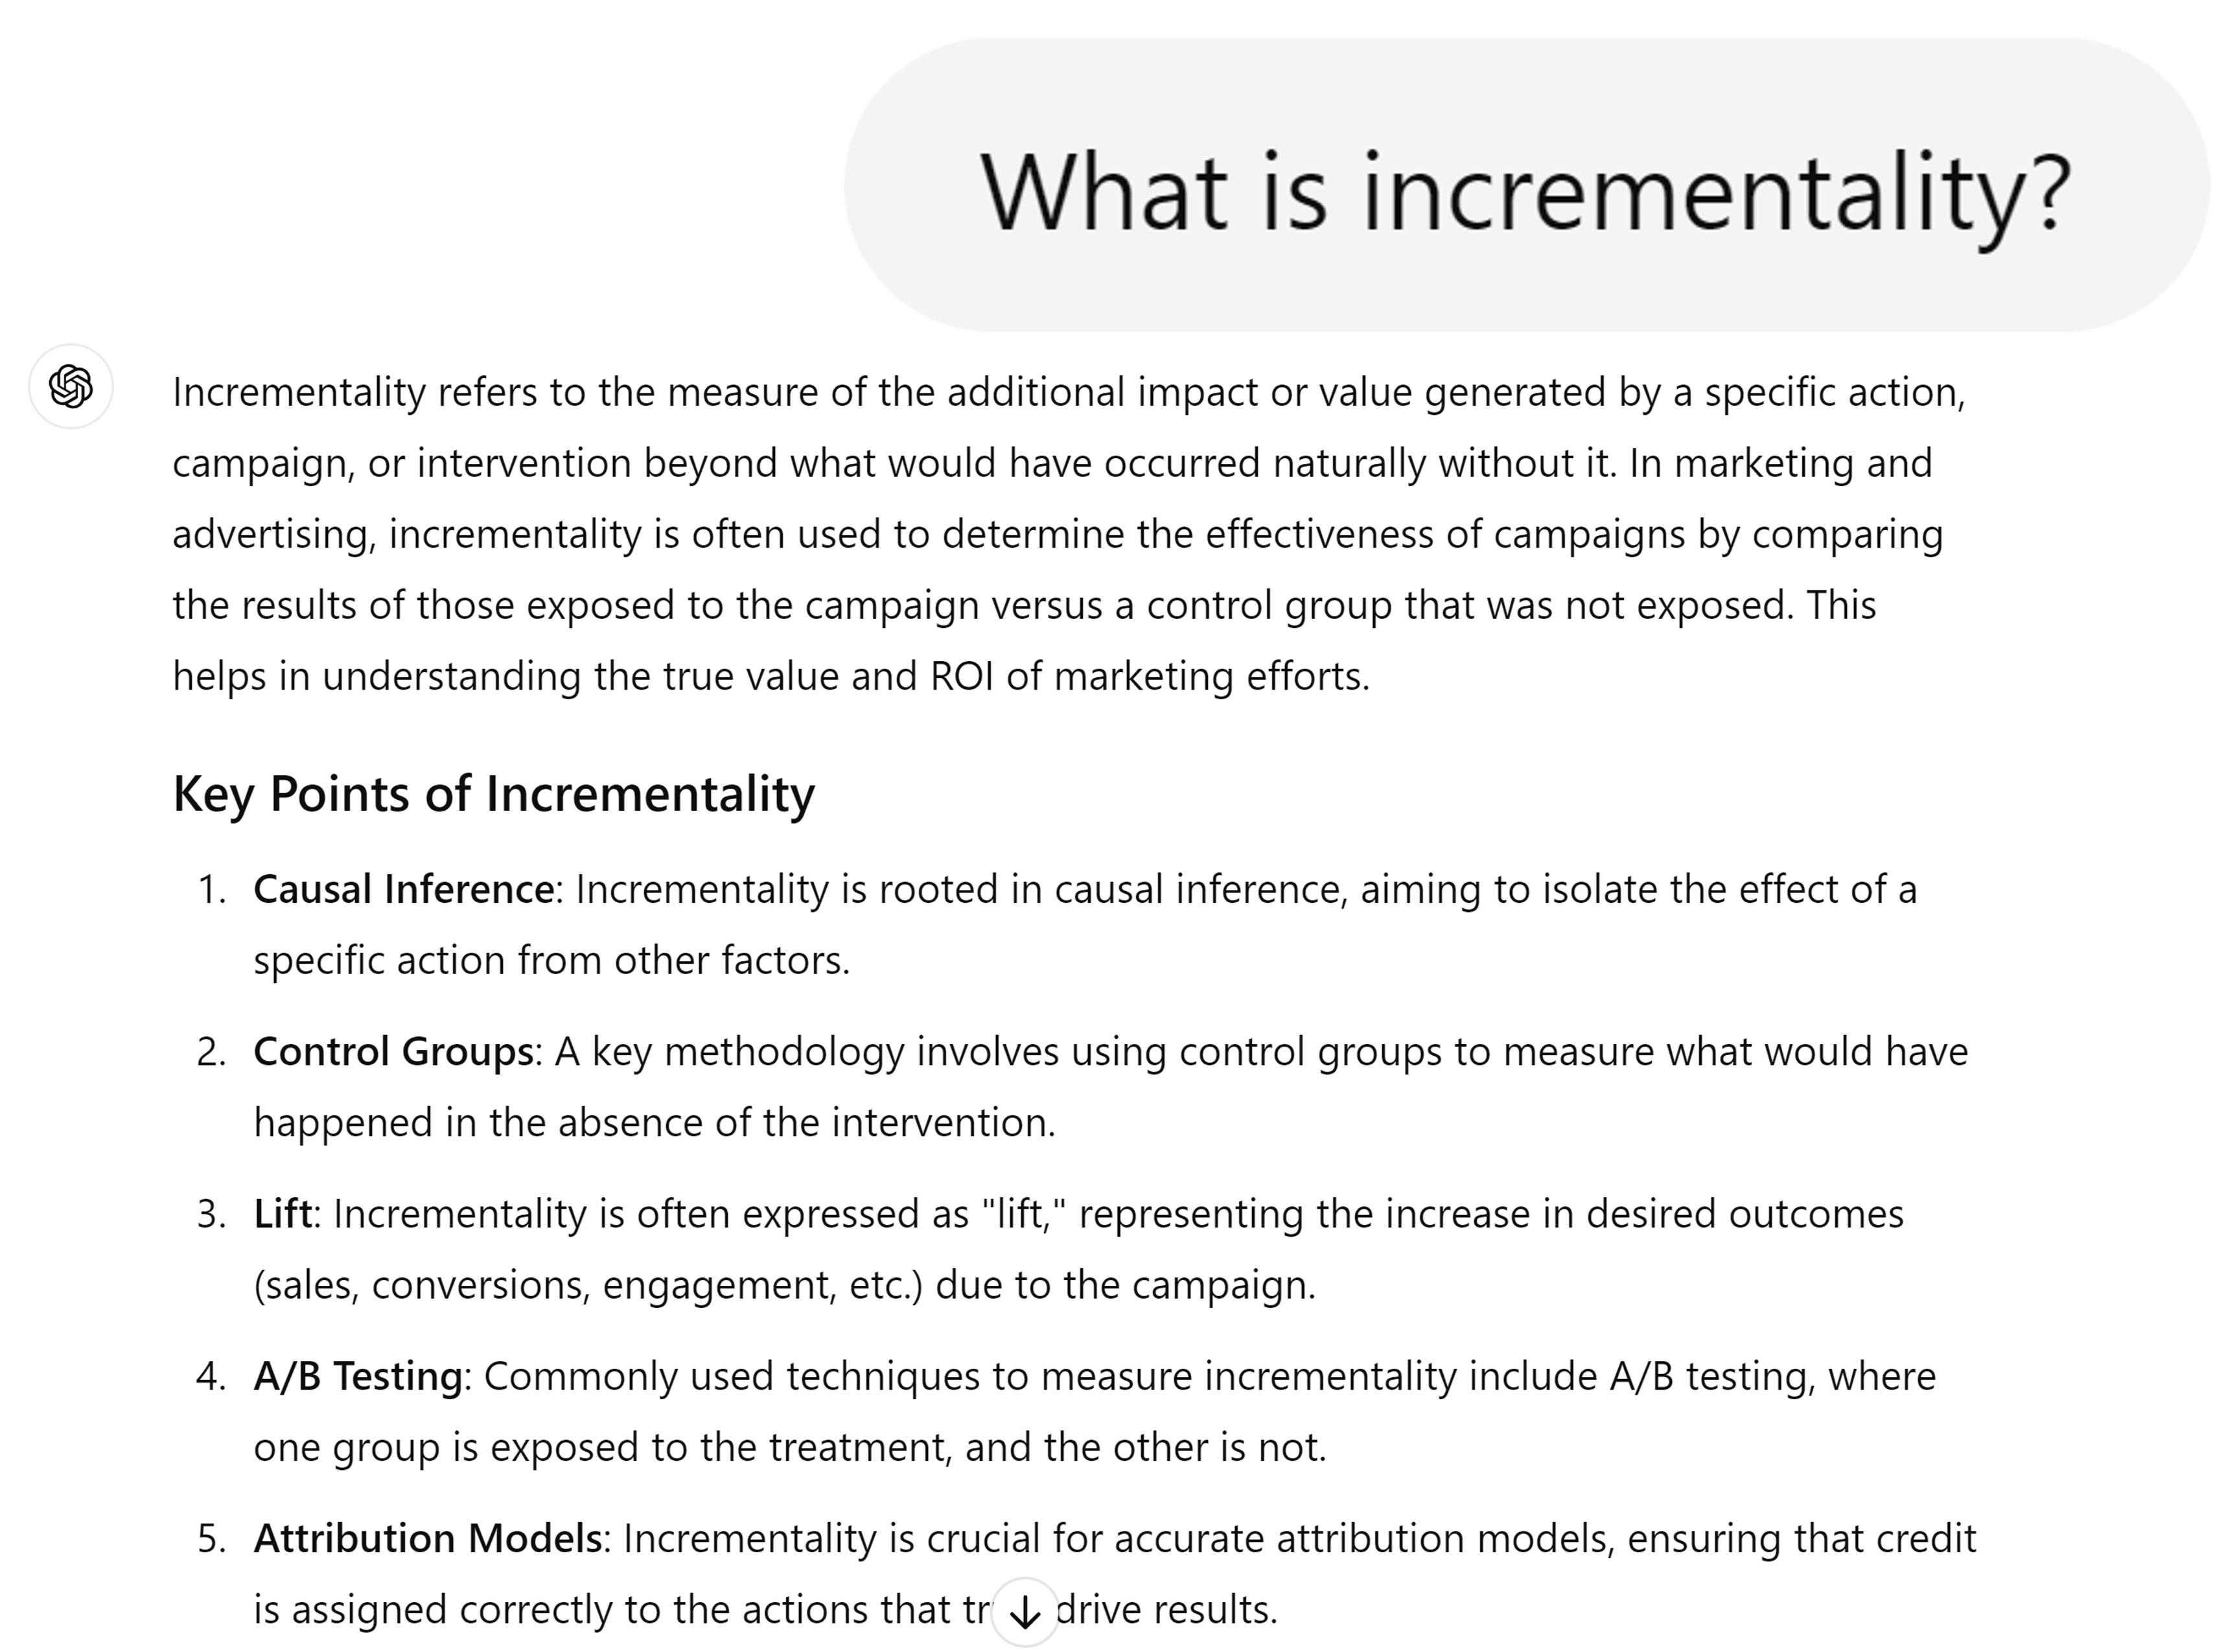
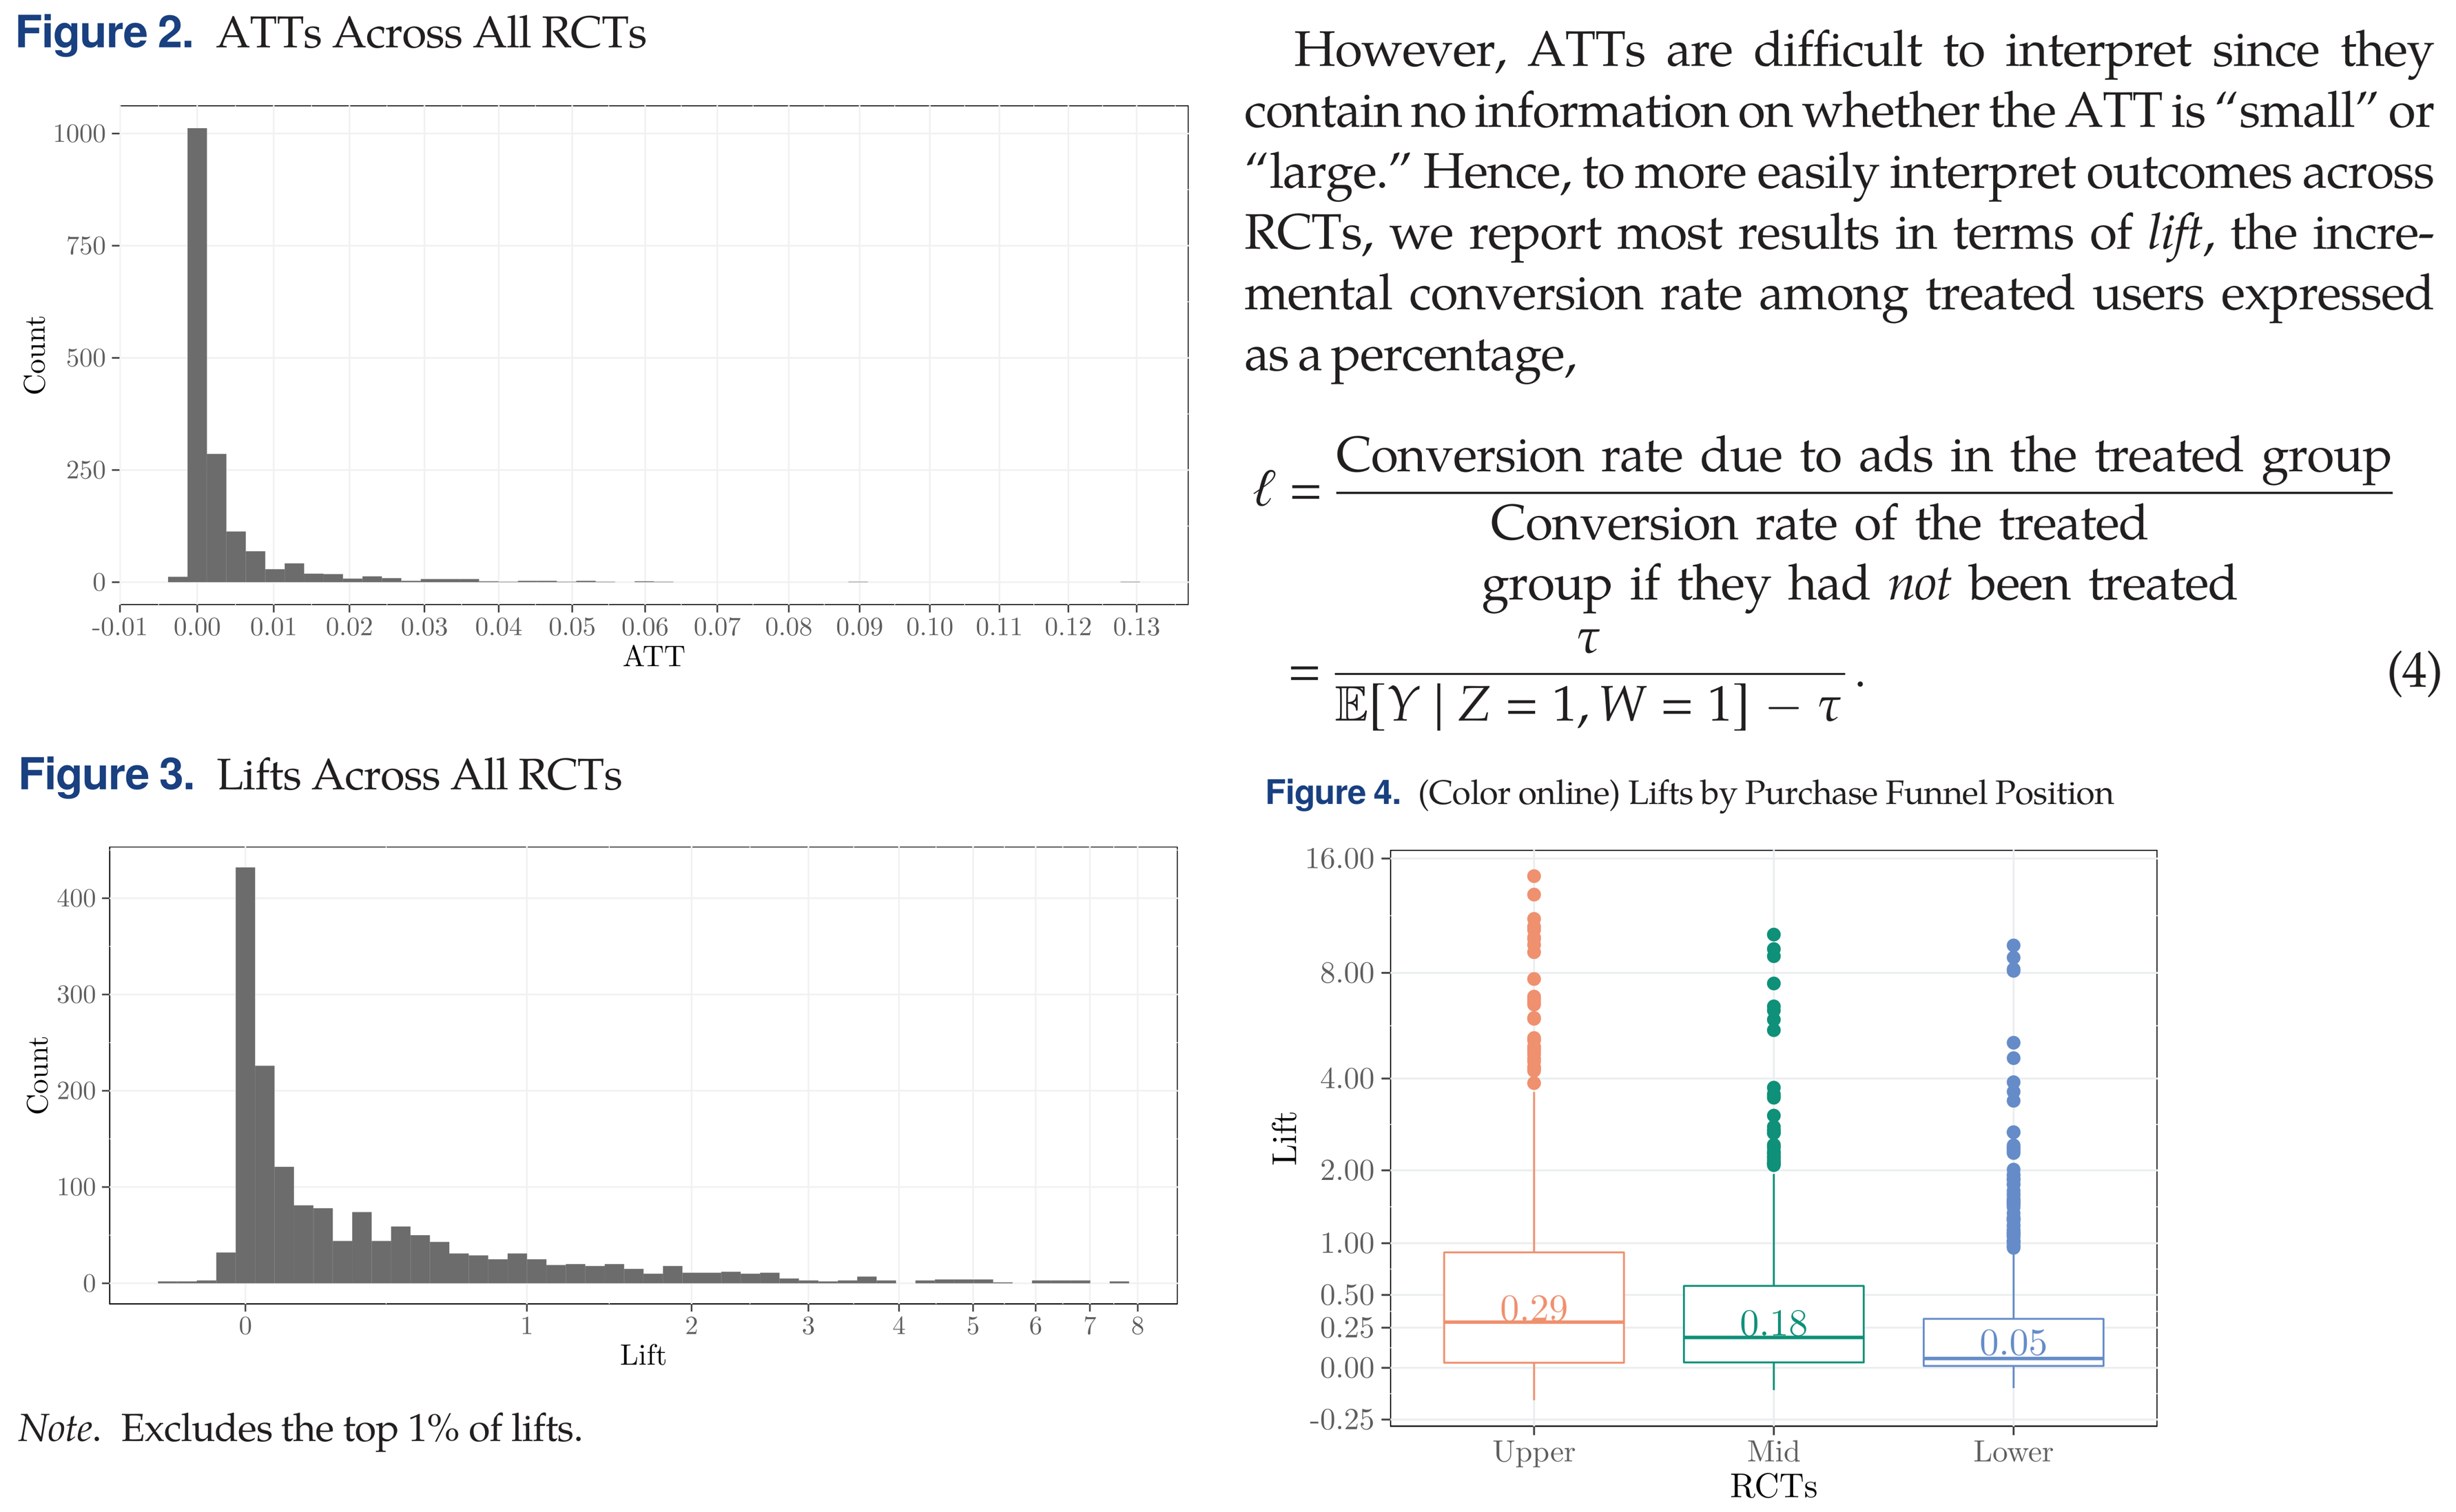
What is Incrementality?
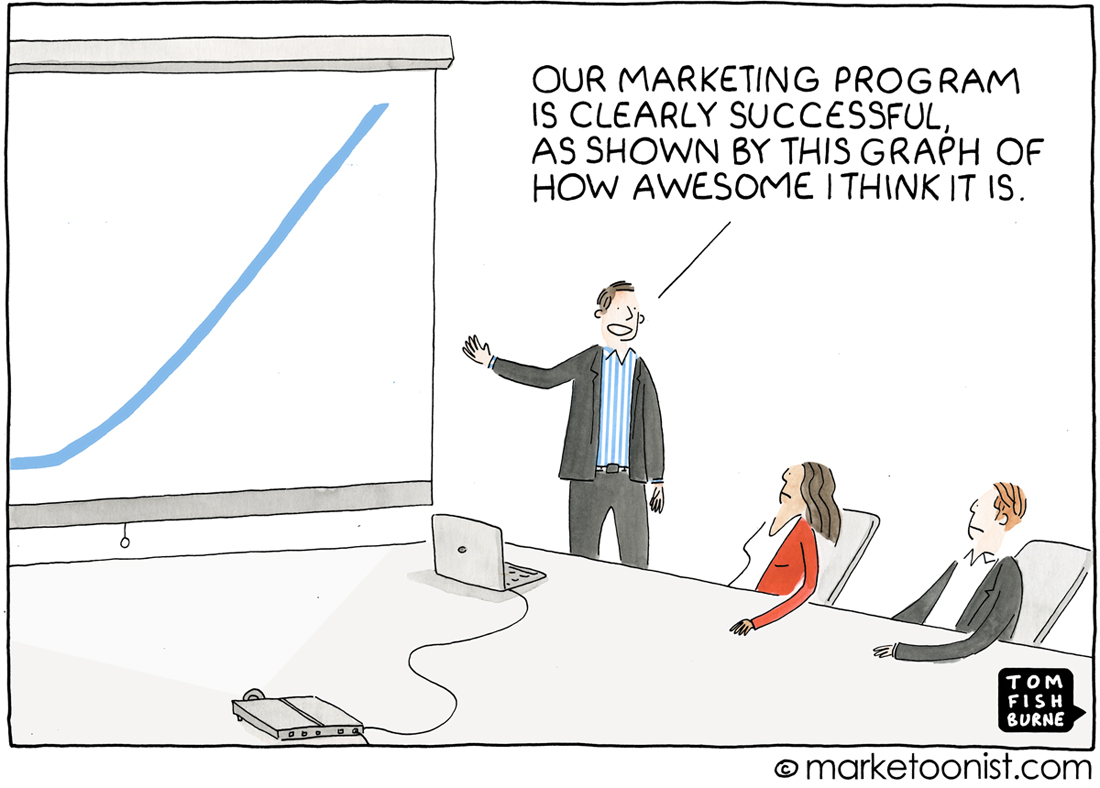
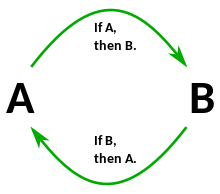
Correlation \(\ne\) Causation

“Revenue too high alert”
Correlation vs Causation

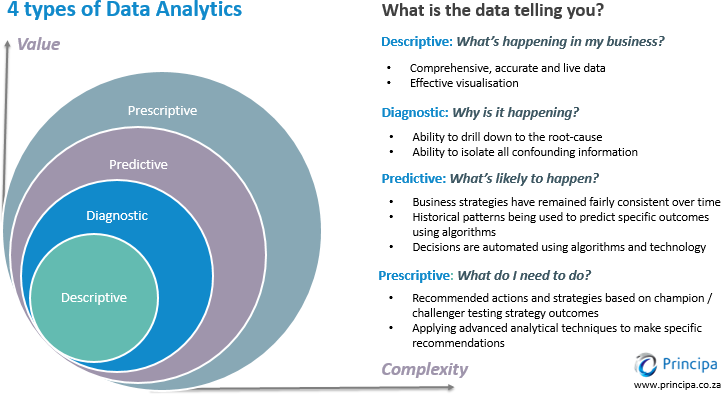
Four Types of Analytics
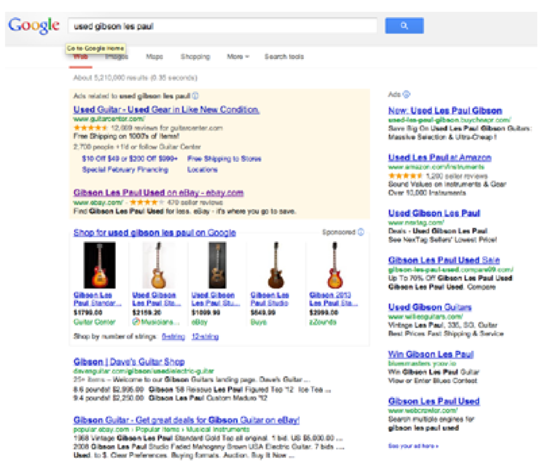
eBay Search Ad Experiments
In 2015 economists working at eBay published a series of geo experiments testing how shutting off paid search ads affected search clicks, sales and attributed sales in a random sample of US cities.
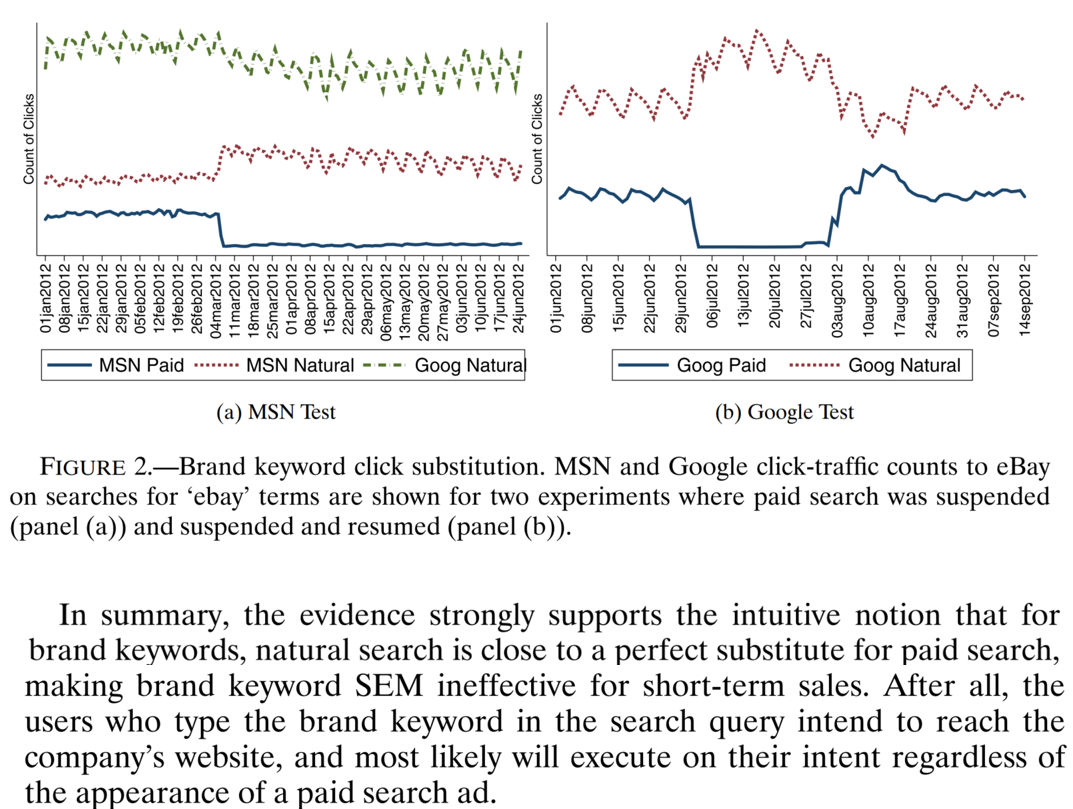
eBay Results: Click Substitution
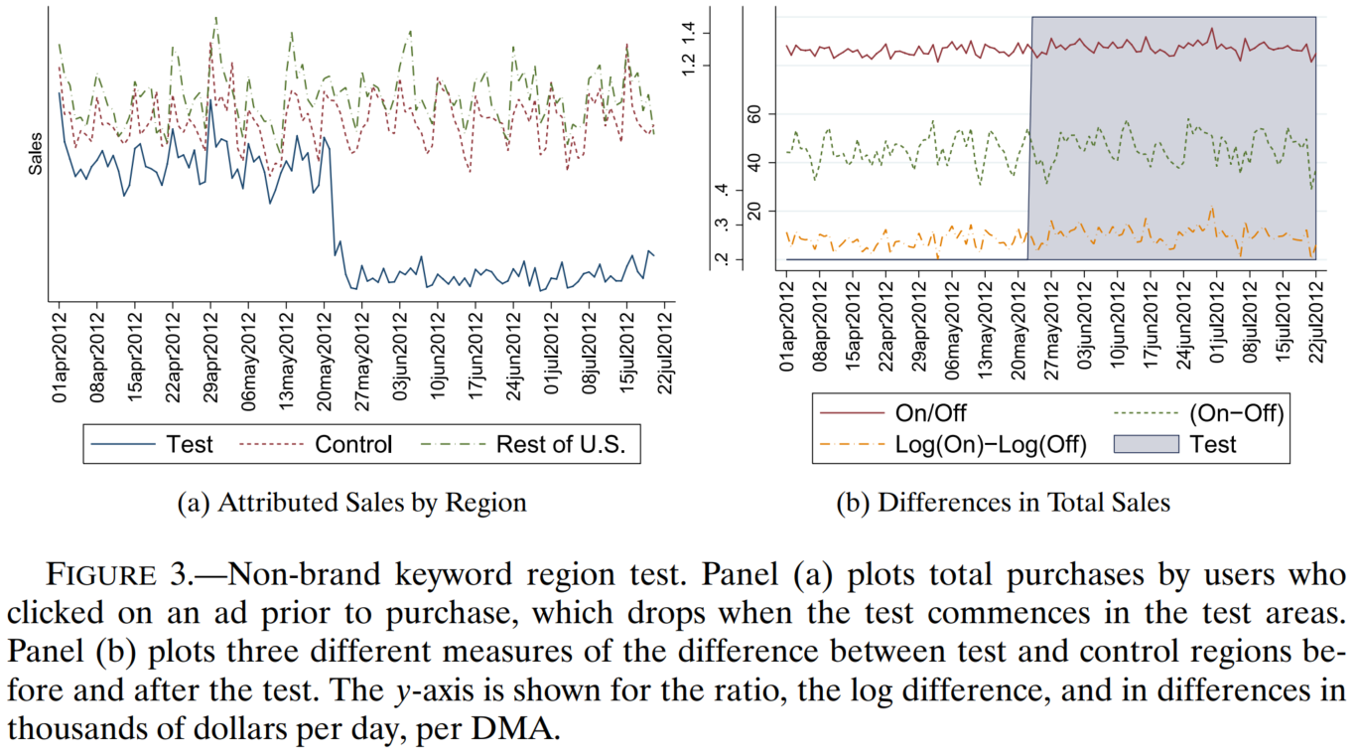
eBay Results: Attribution vs Reality
Did the eBay result generalize to other companies?
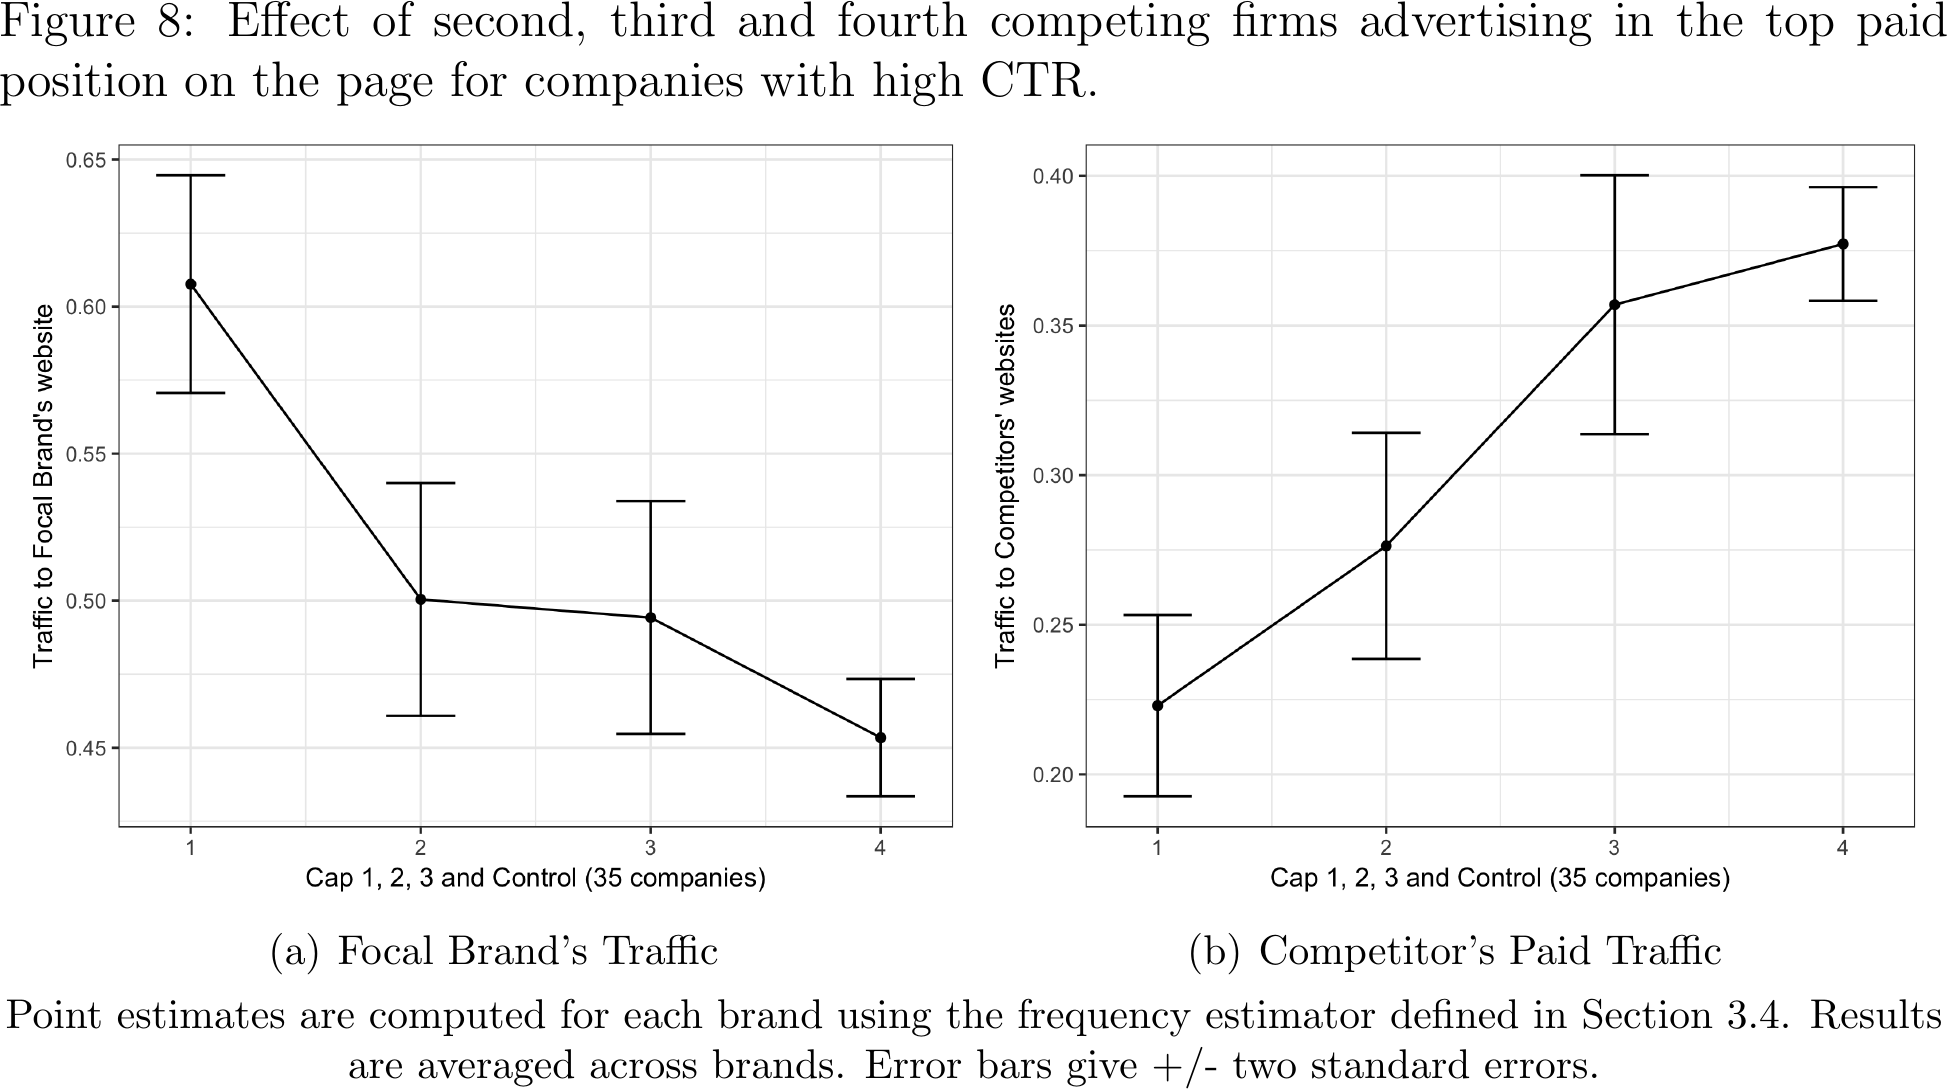
Did Other Firms Learn from eBay?
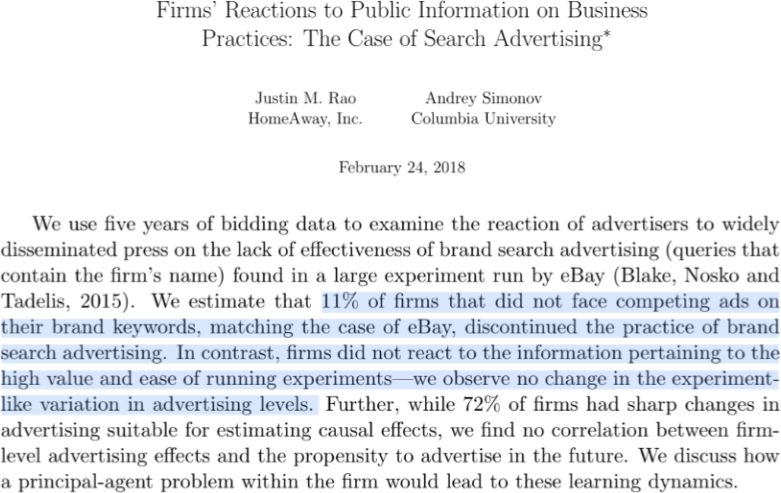
eBay Case Study: Key Takeaways

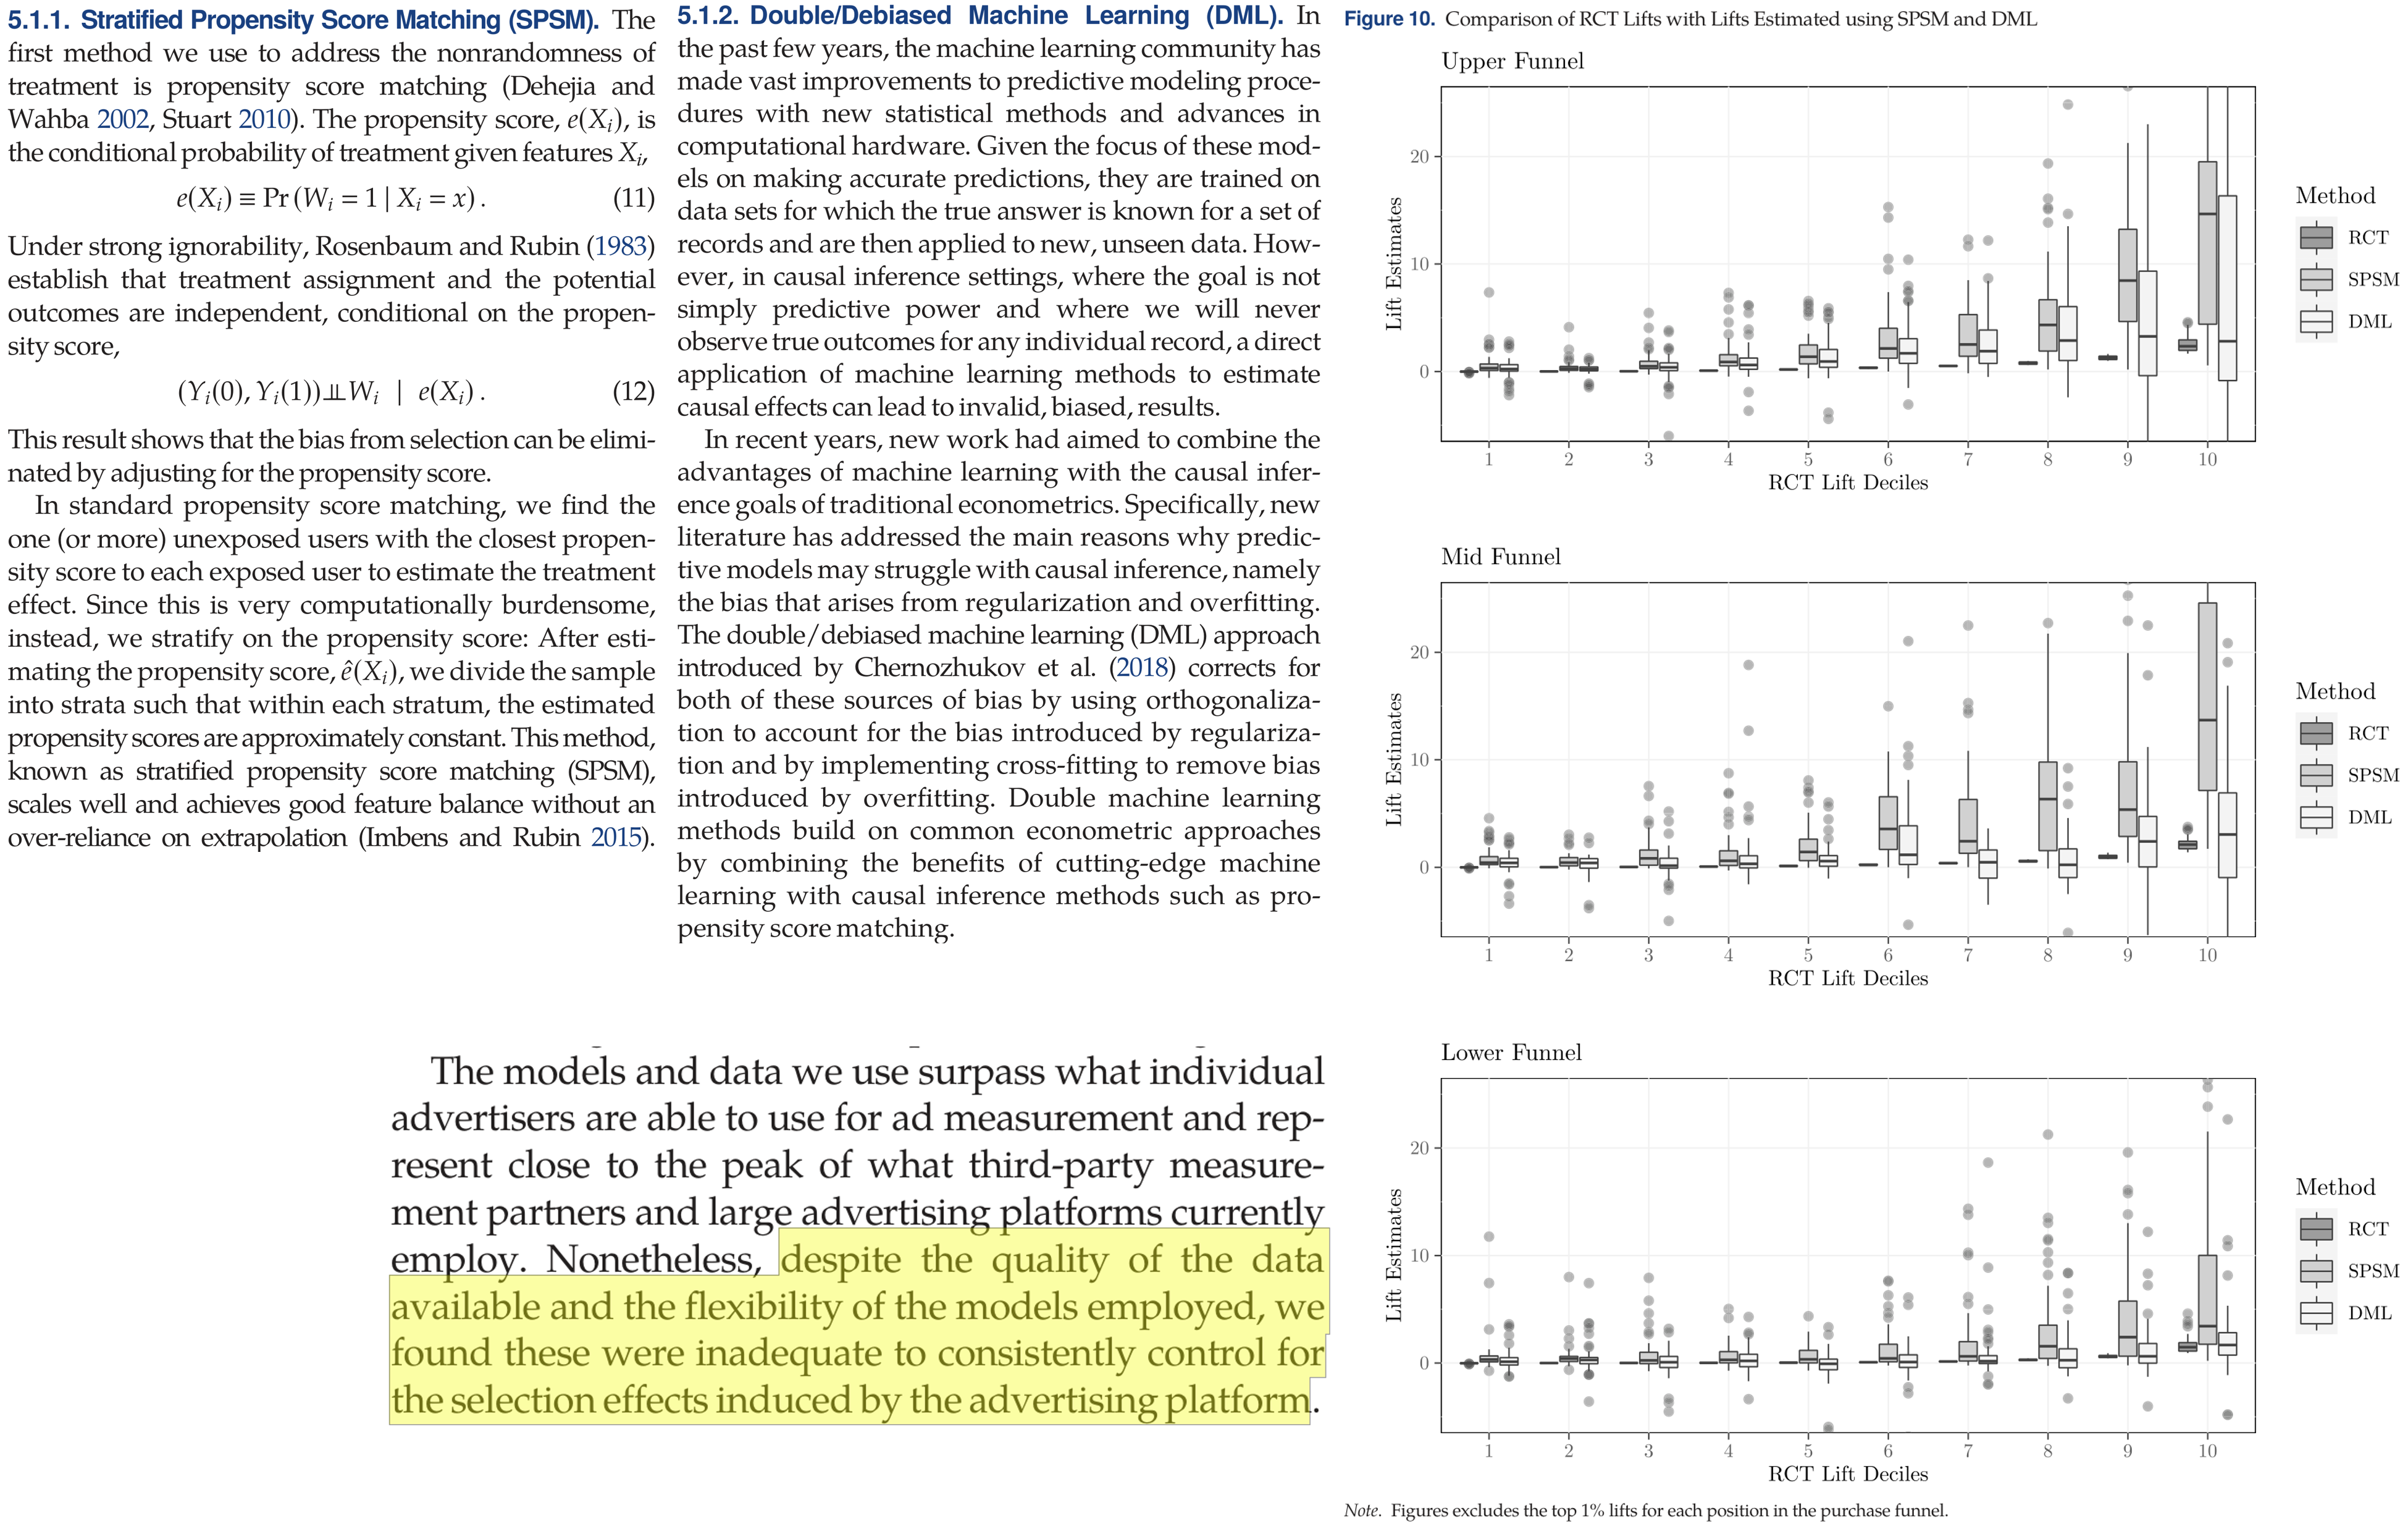
“Grading Your Own Homework”

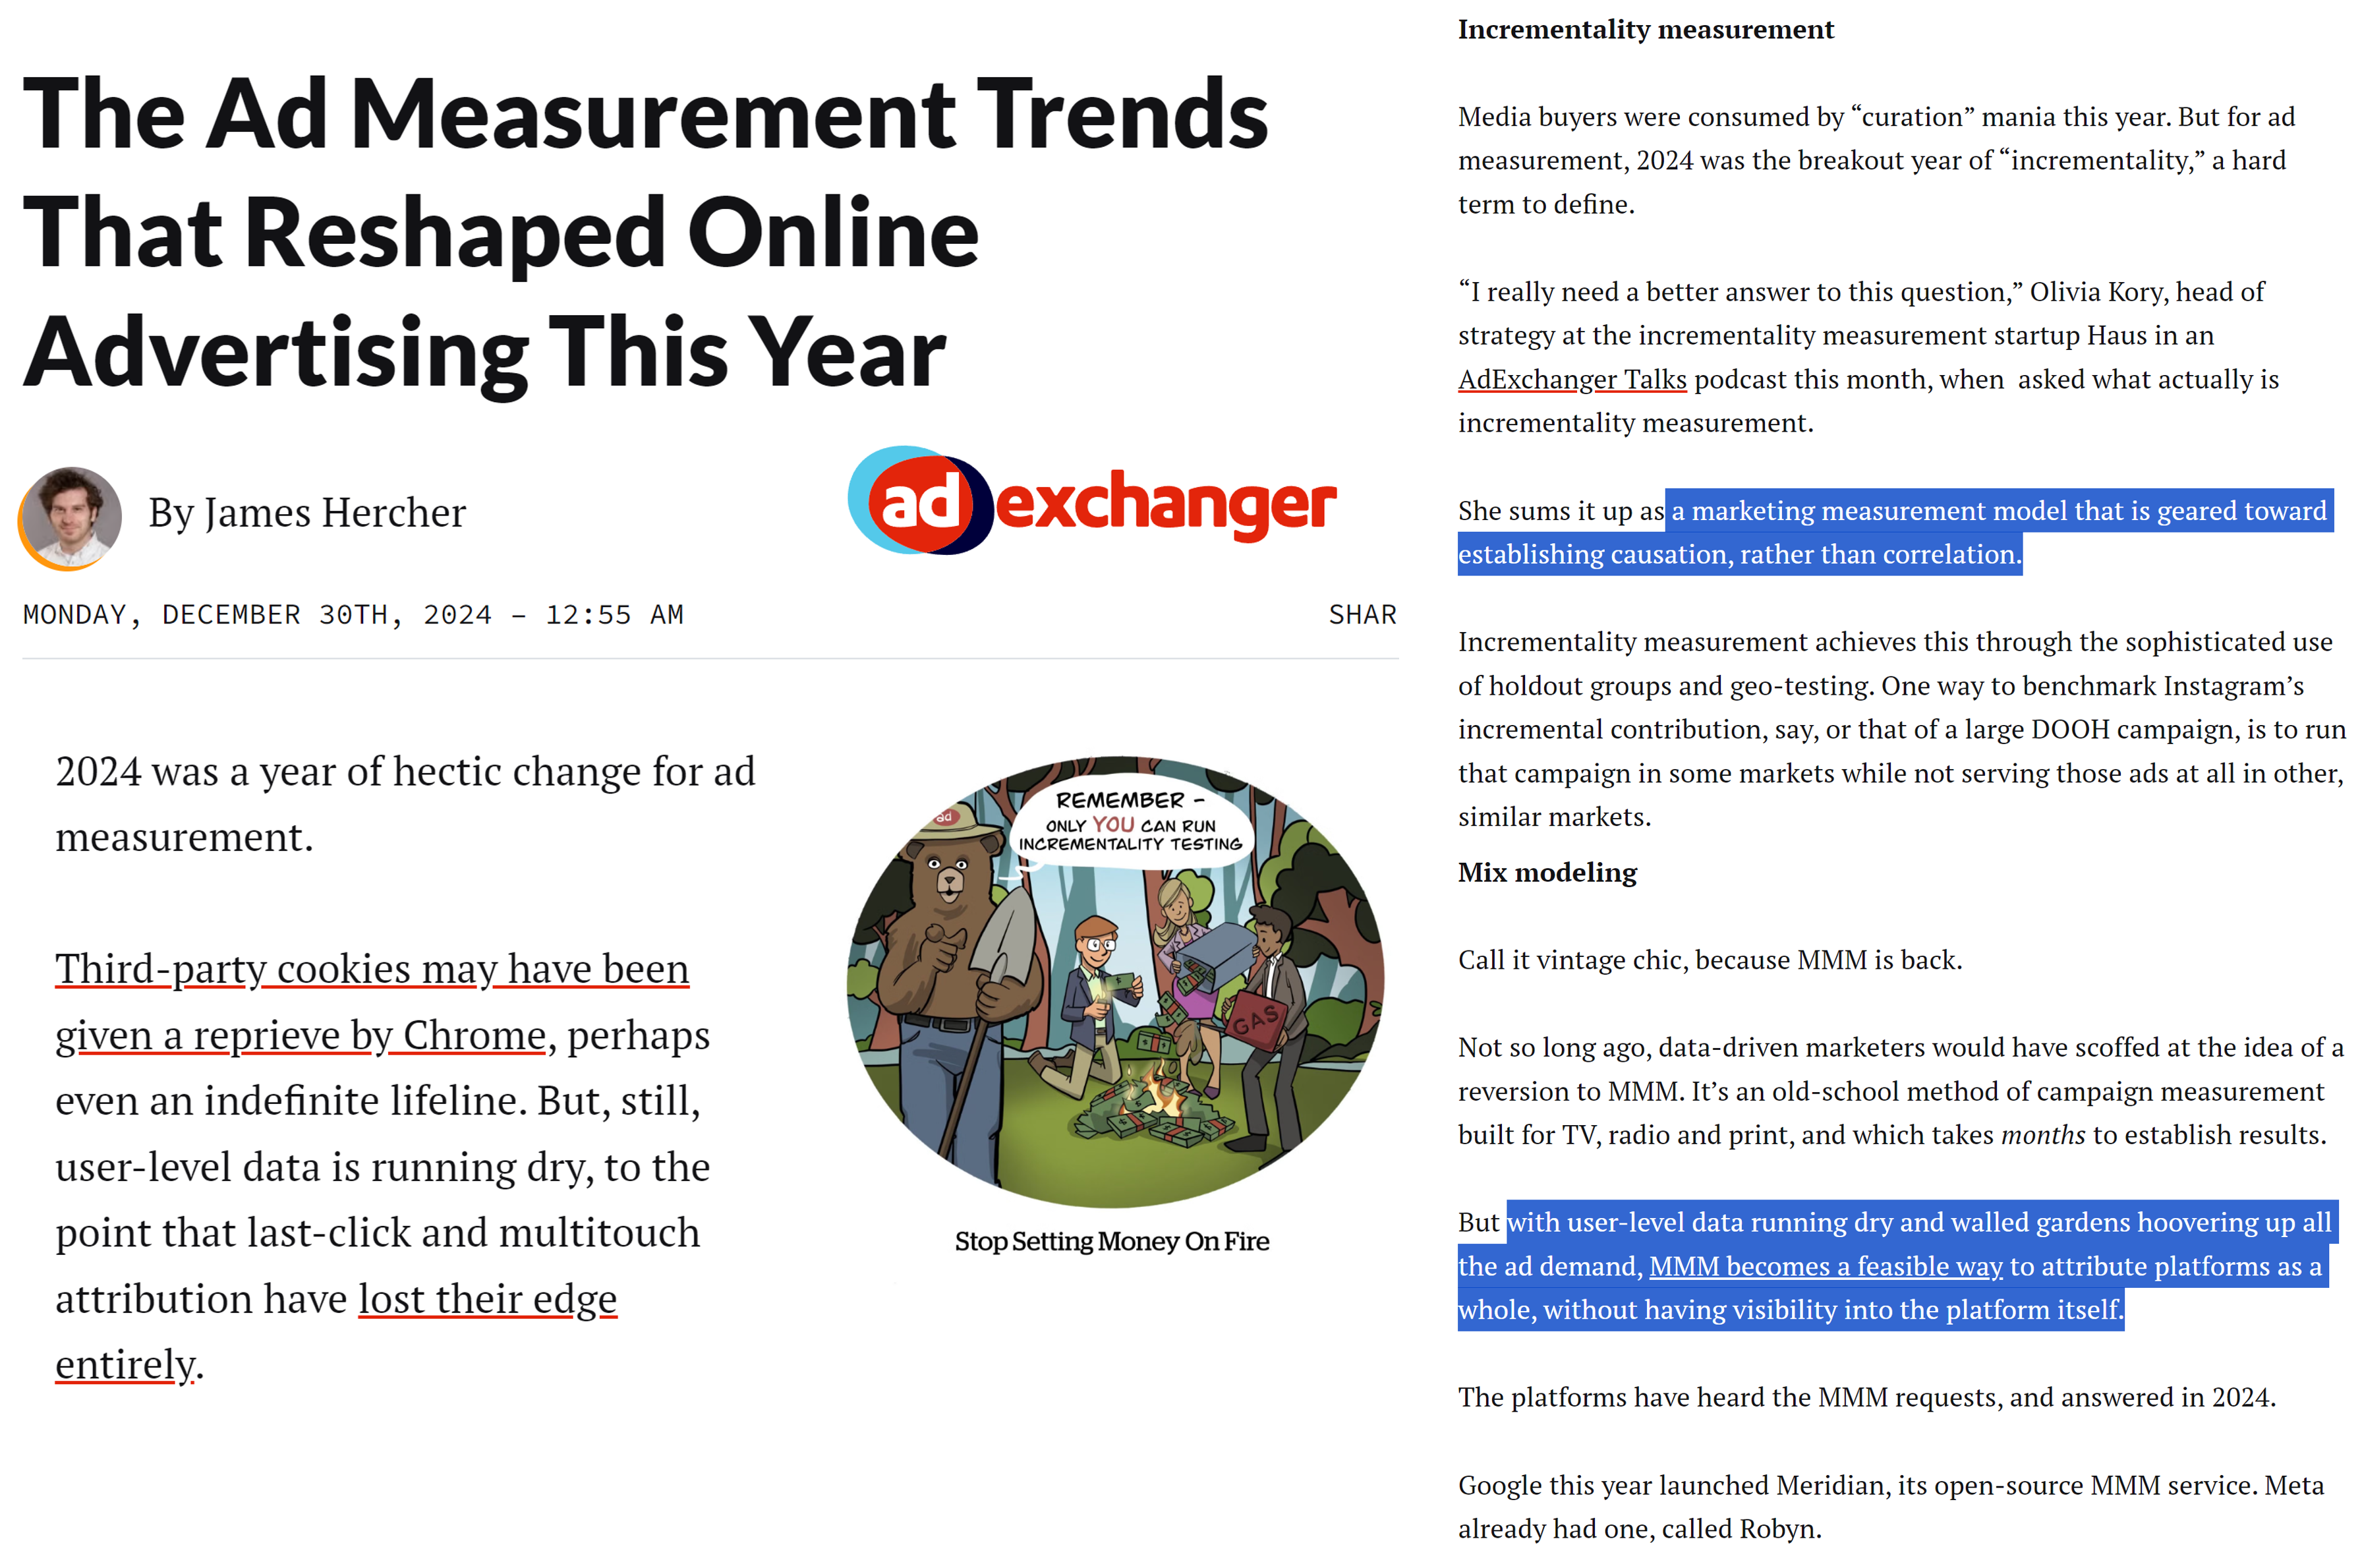
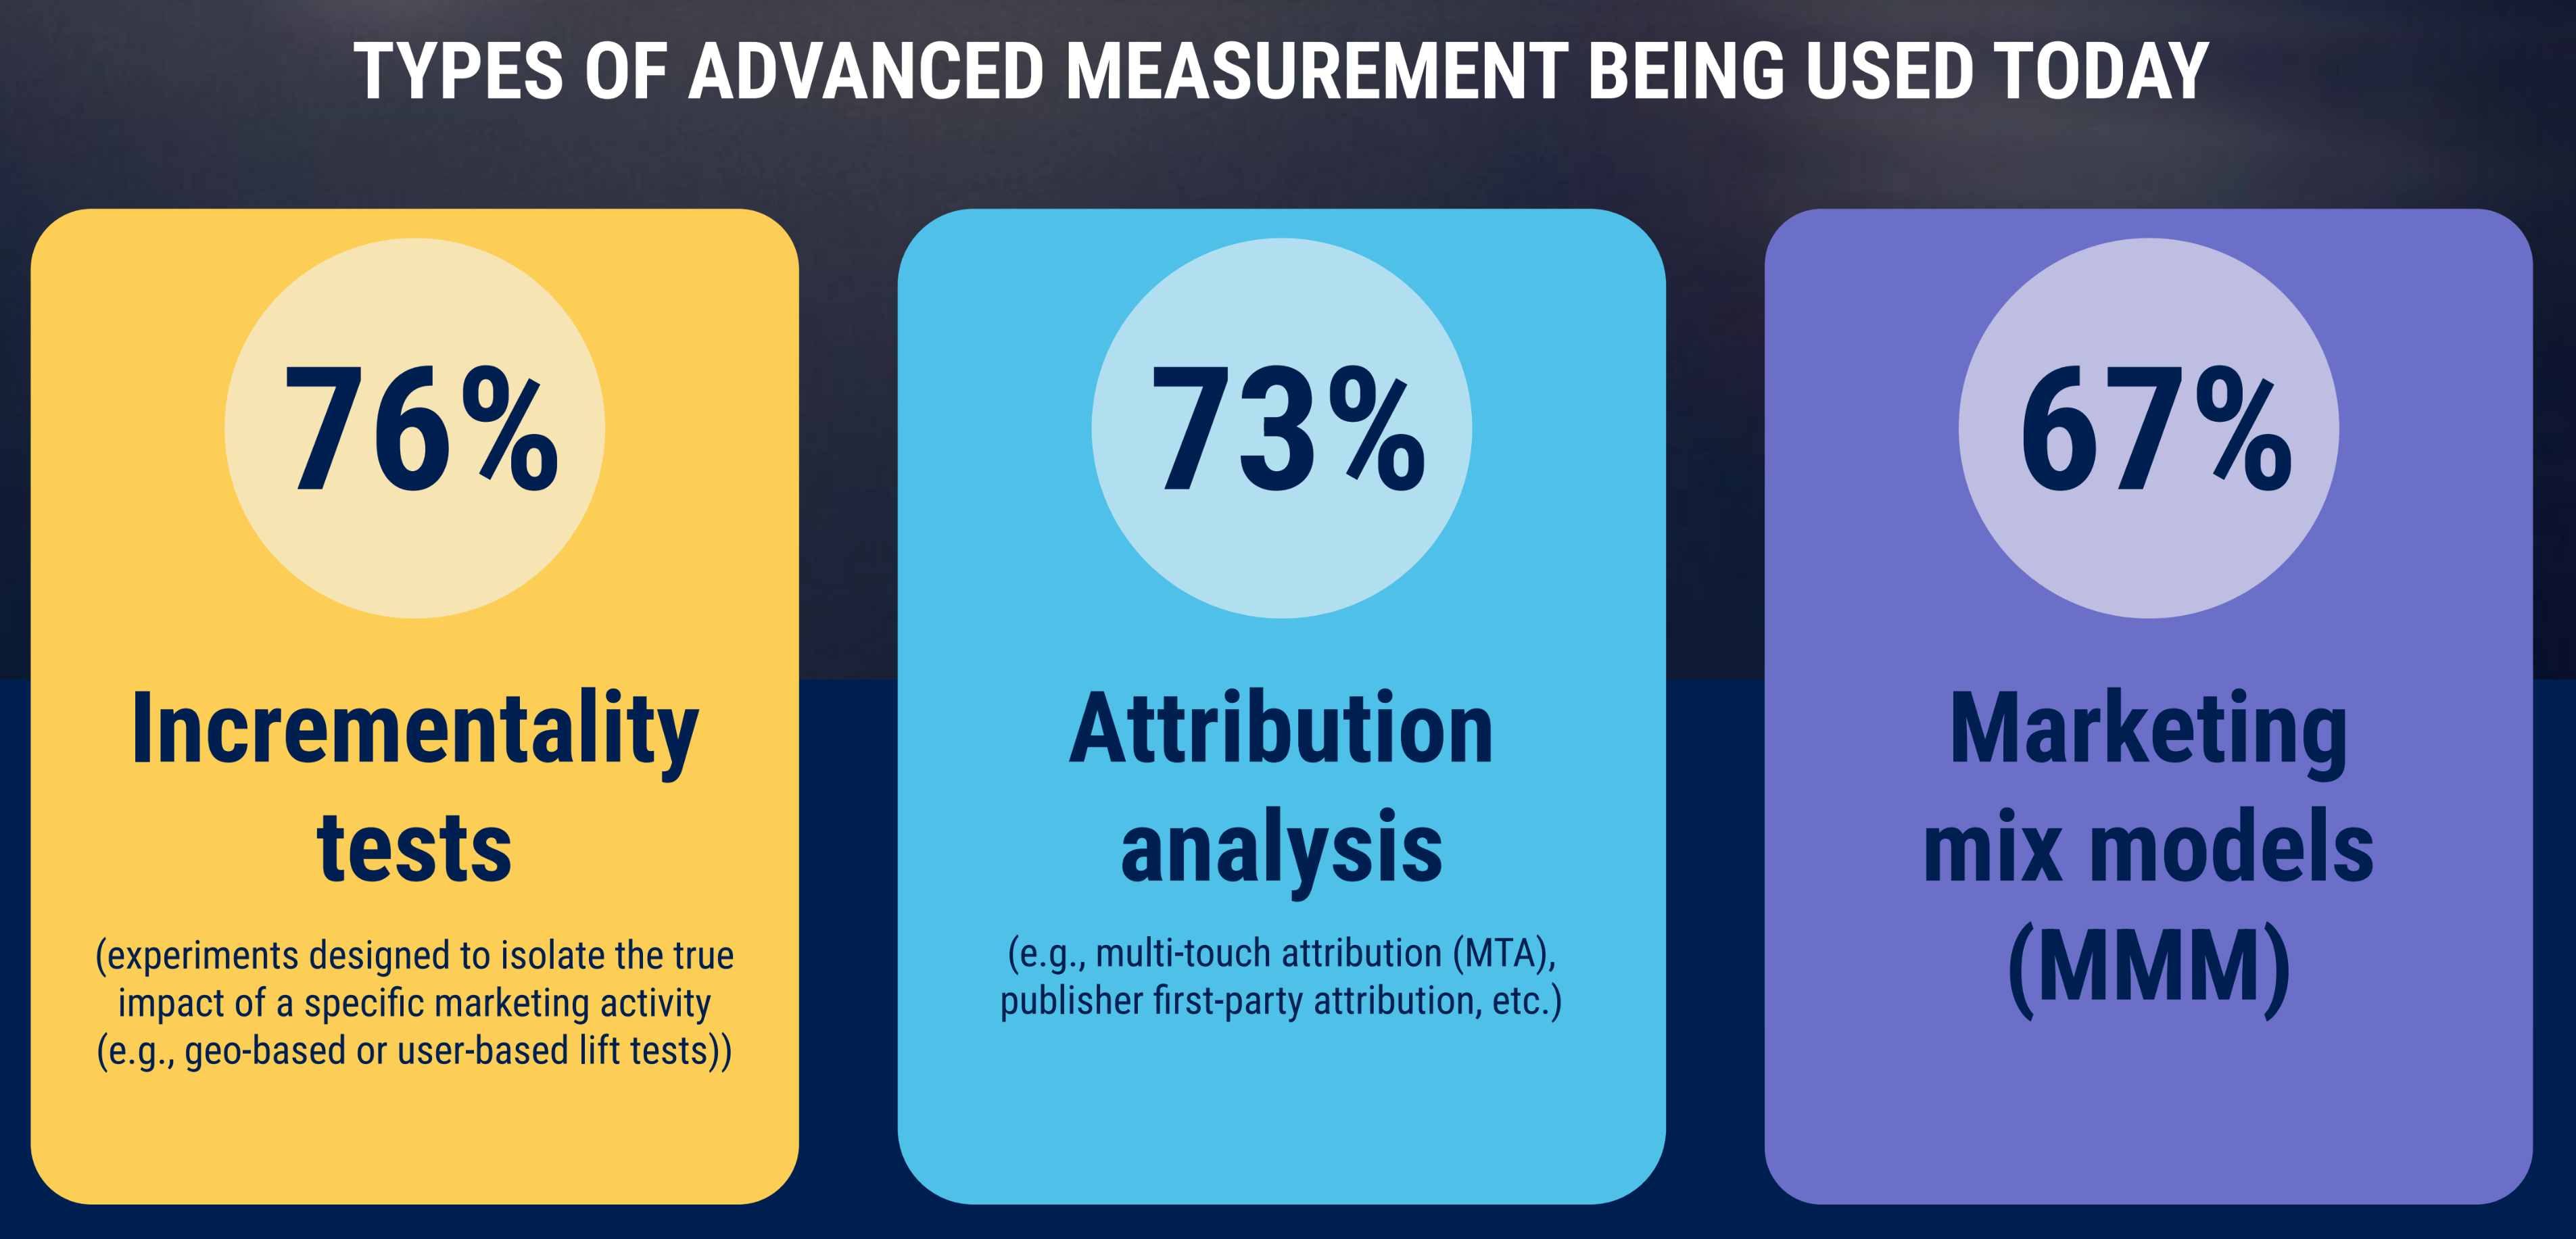
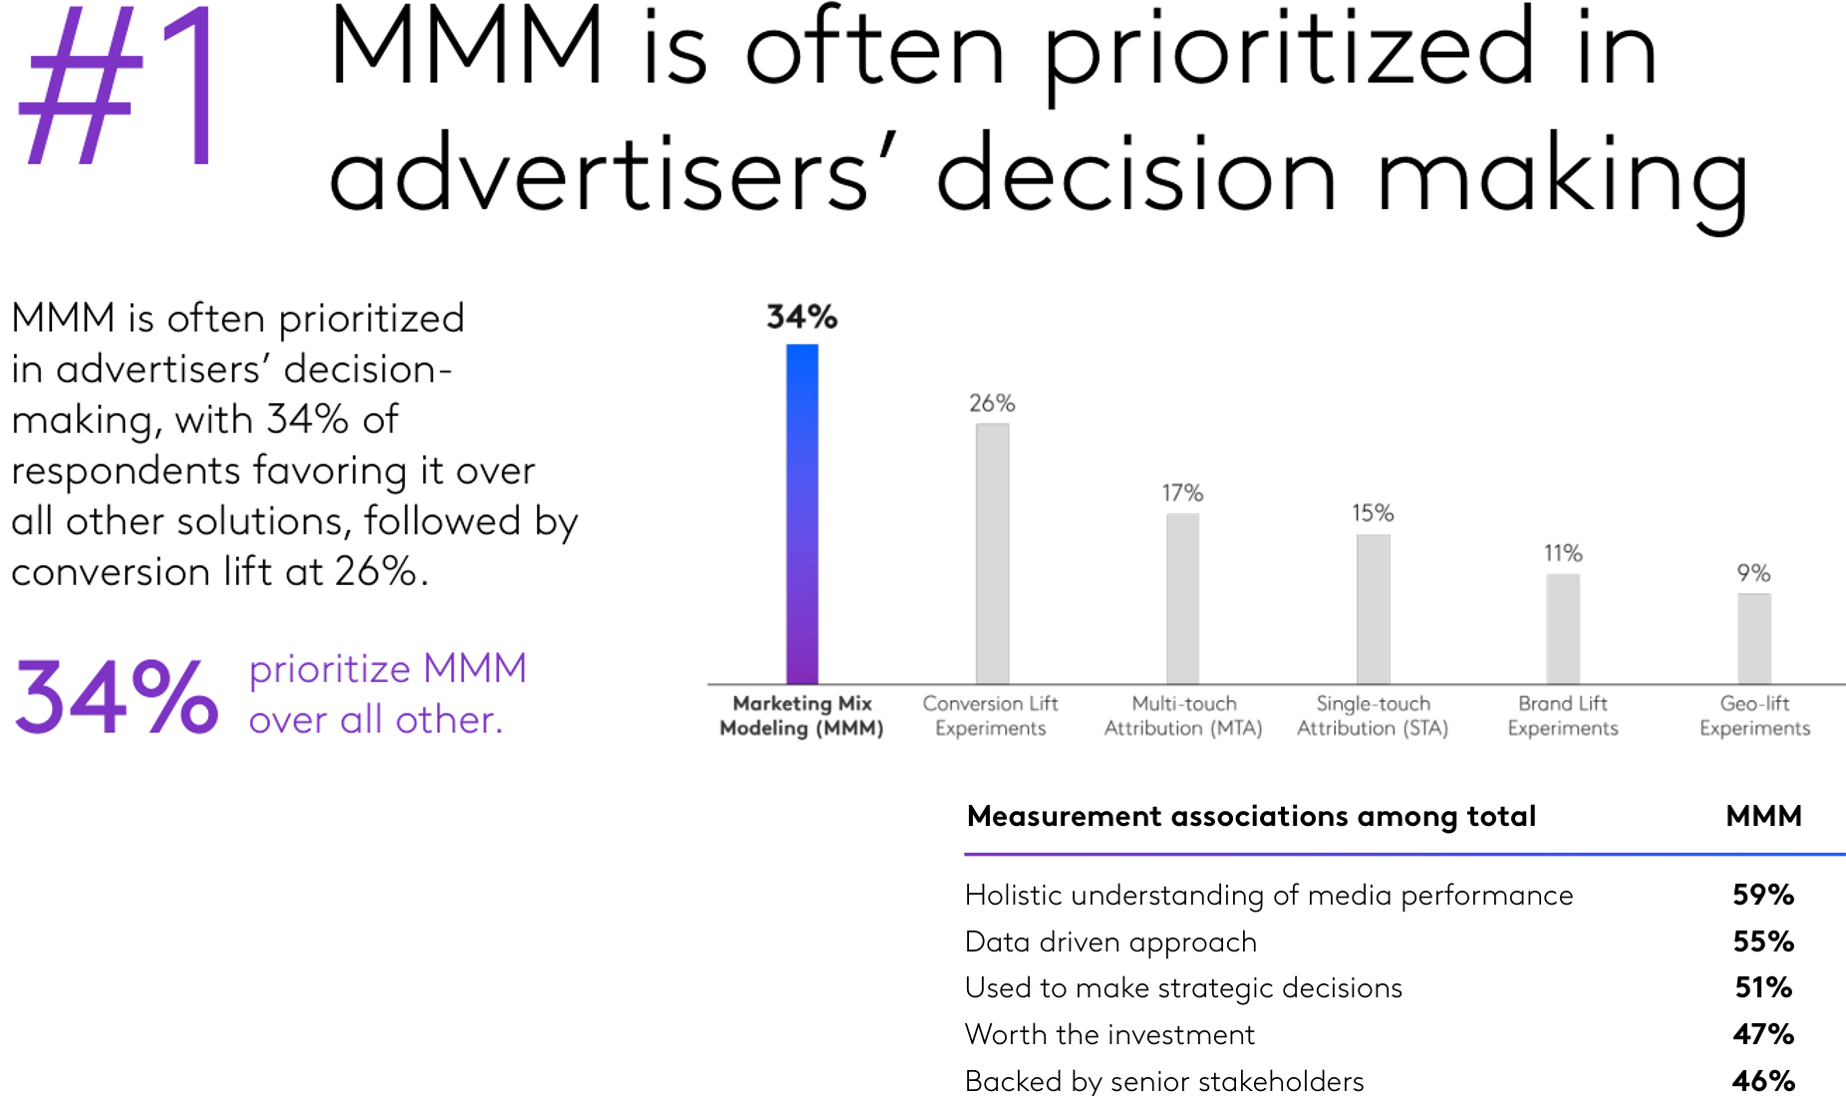
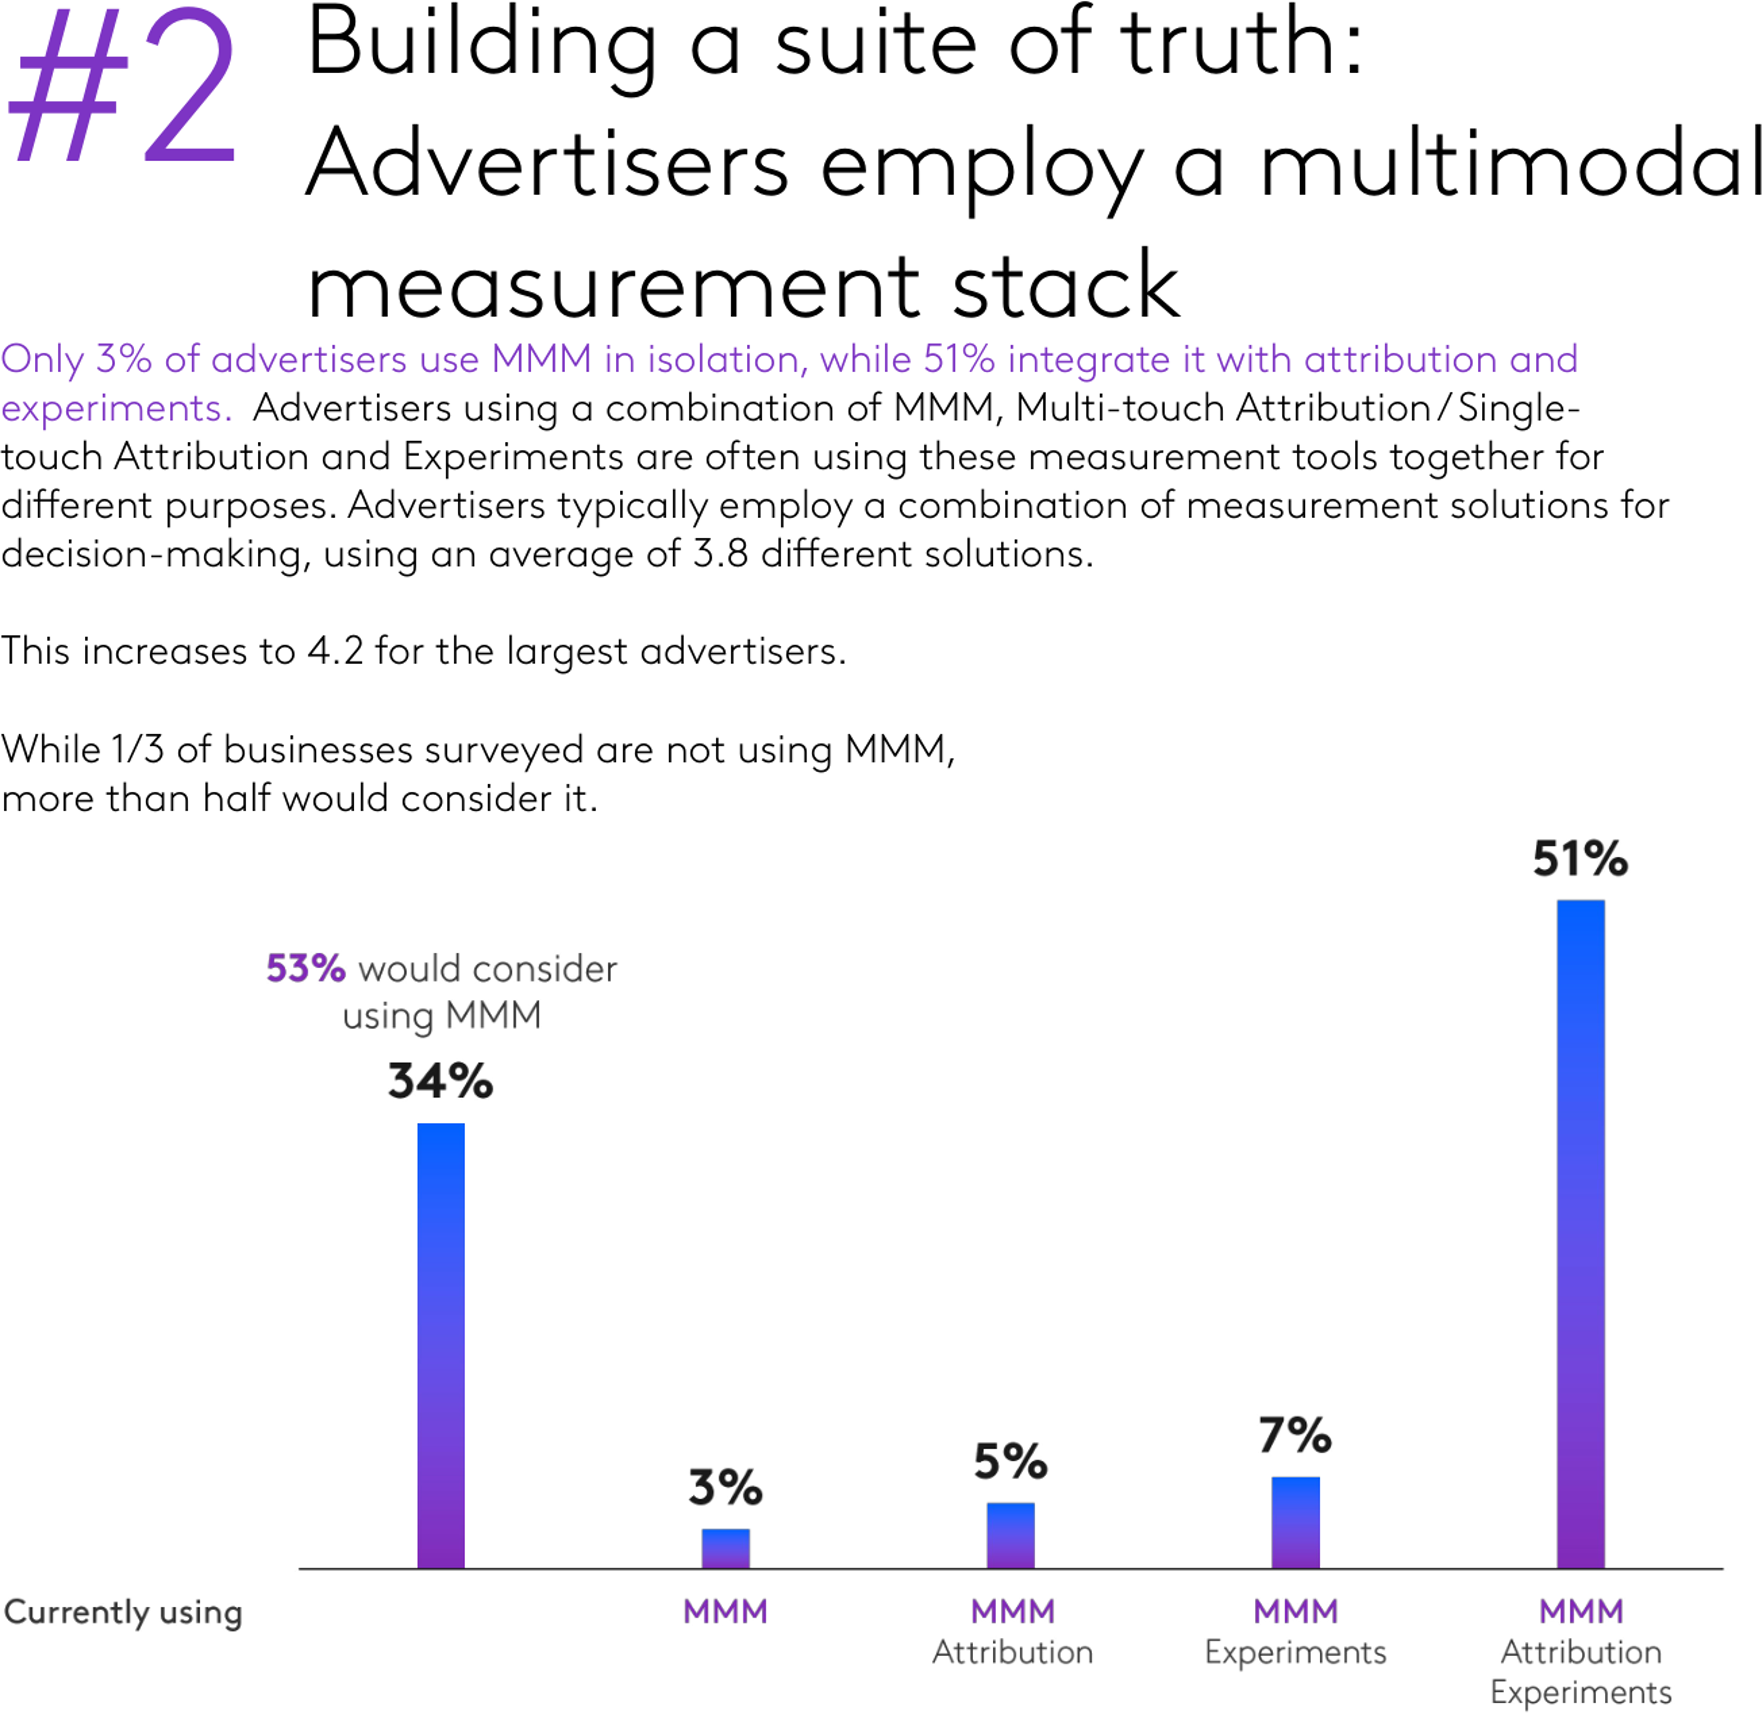
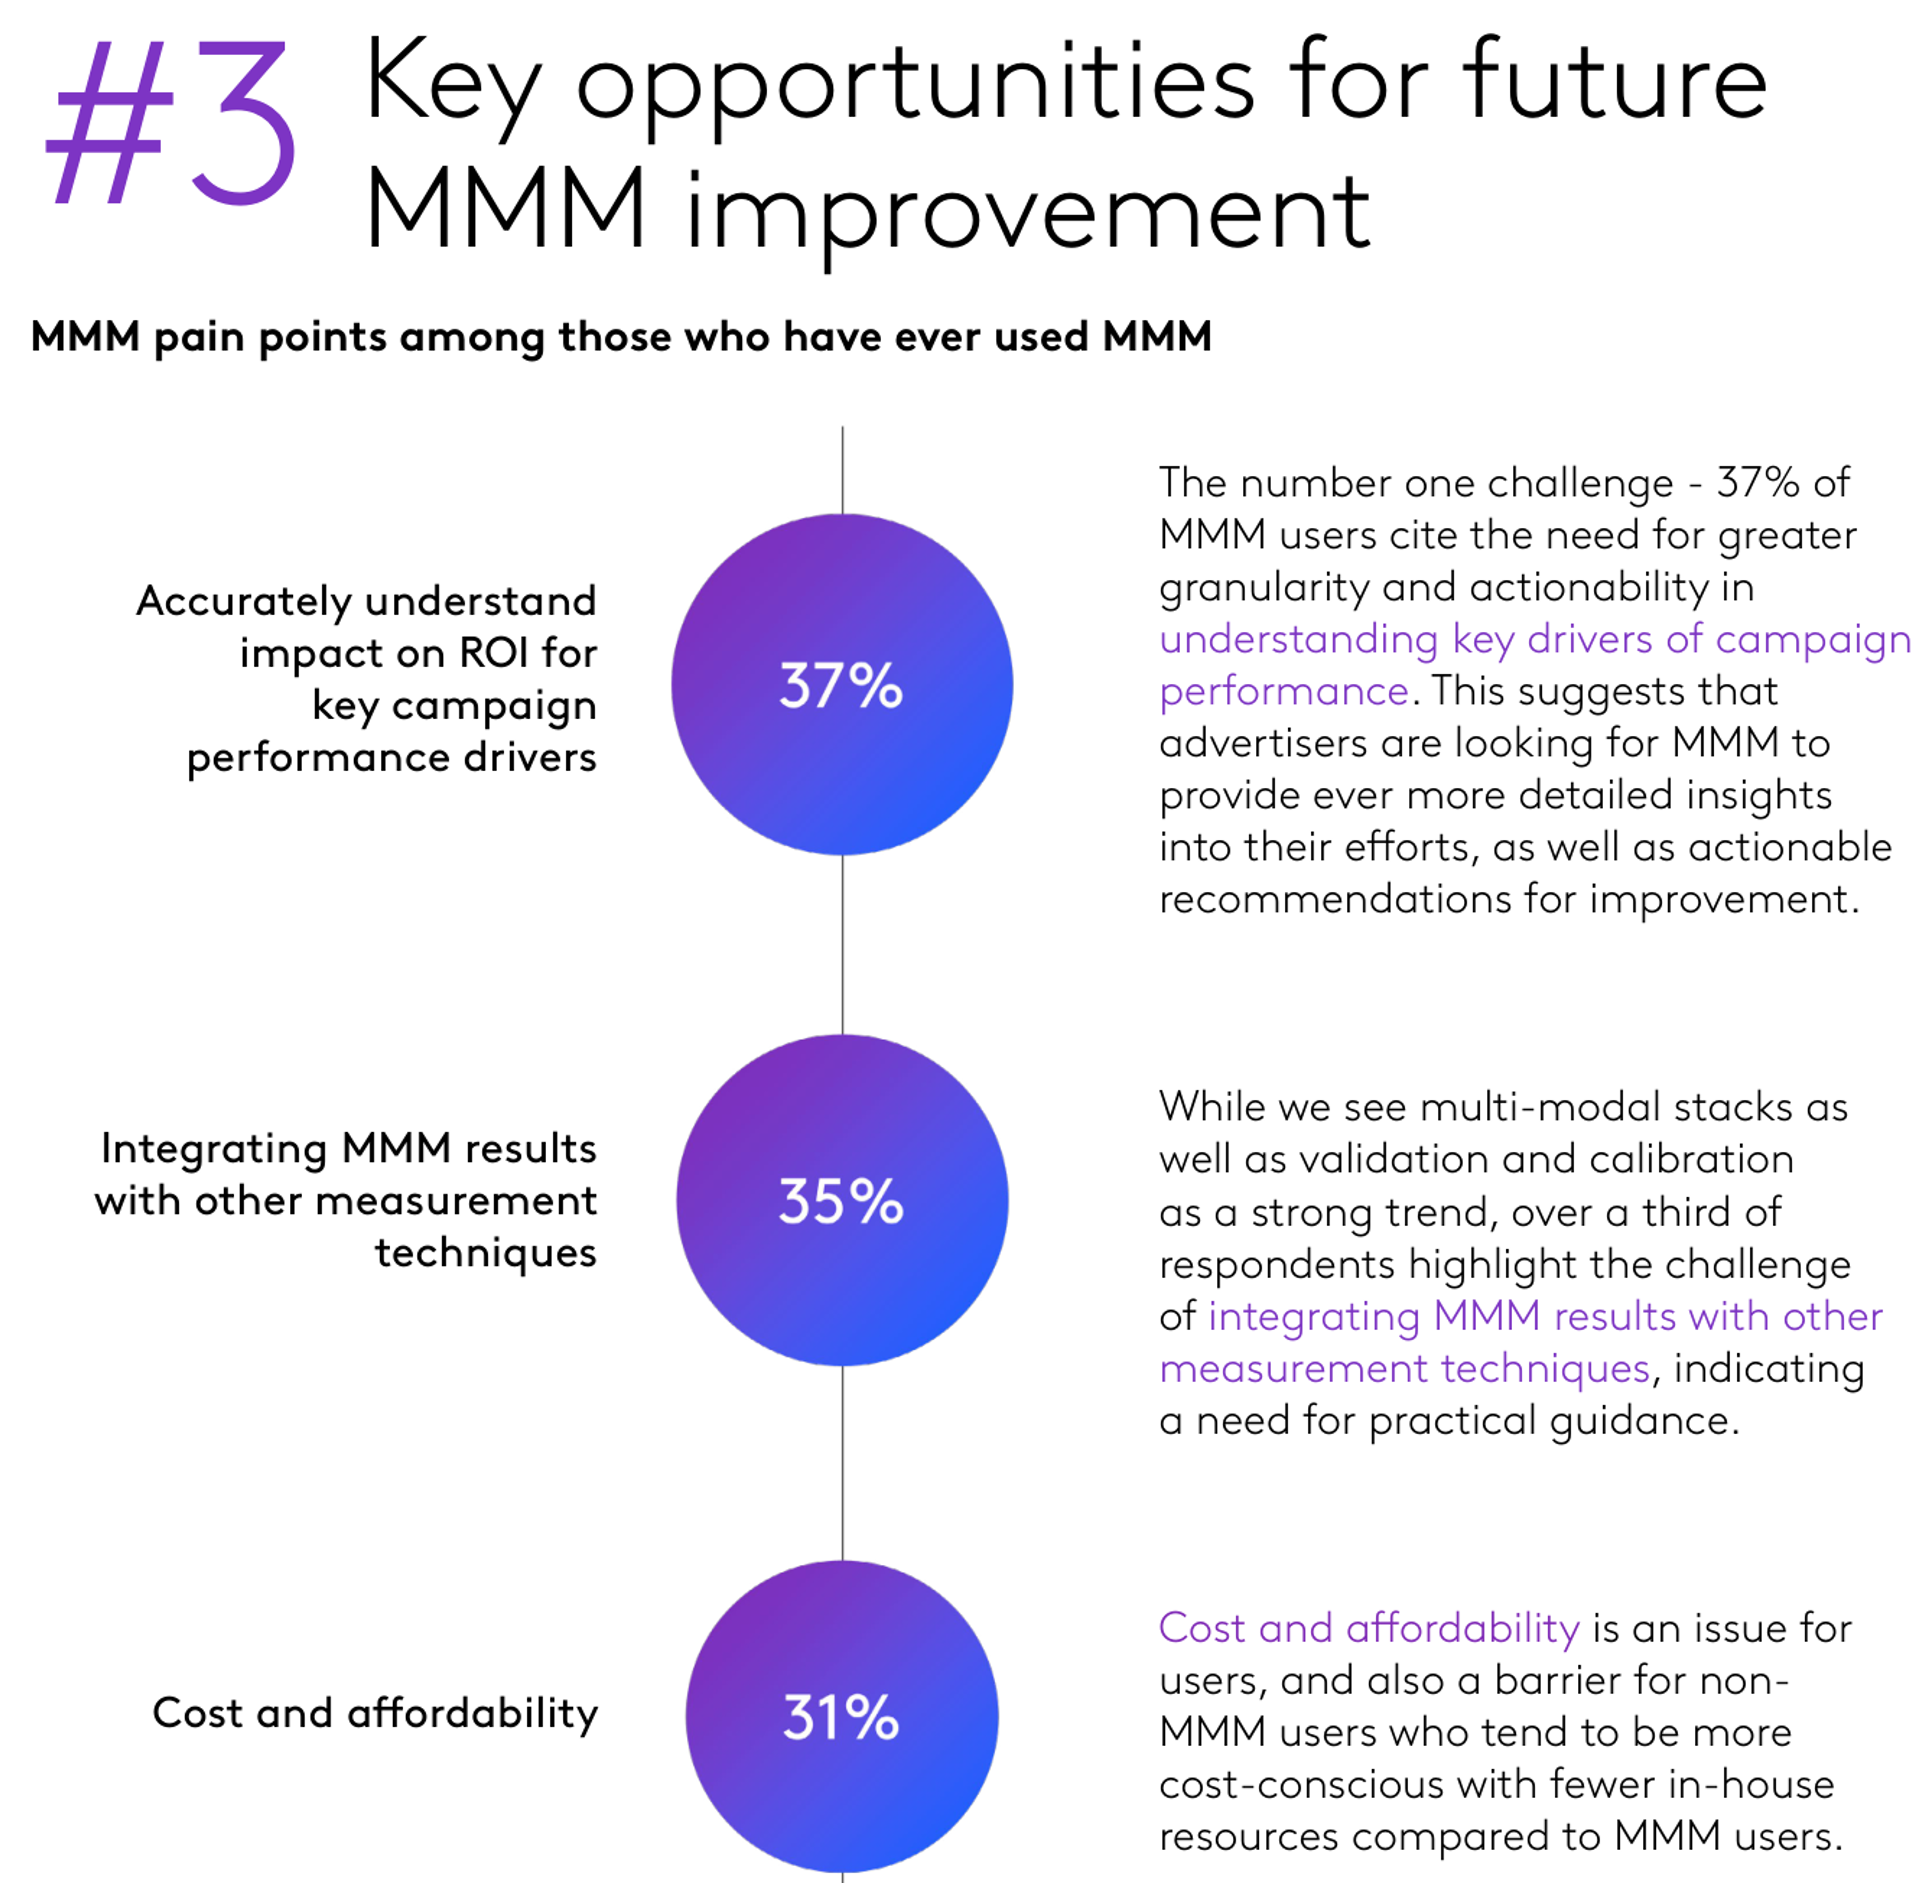
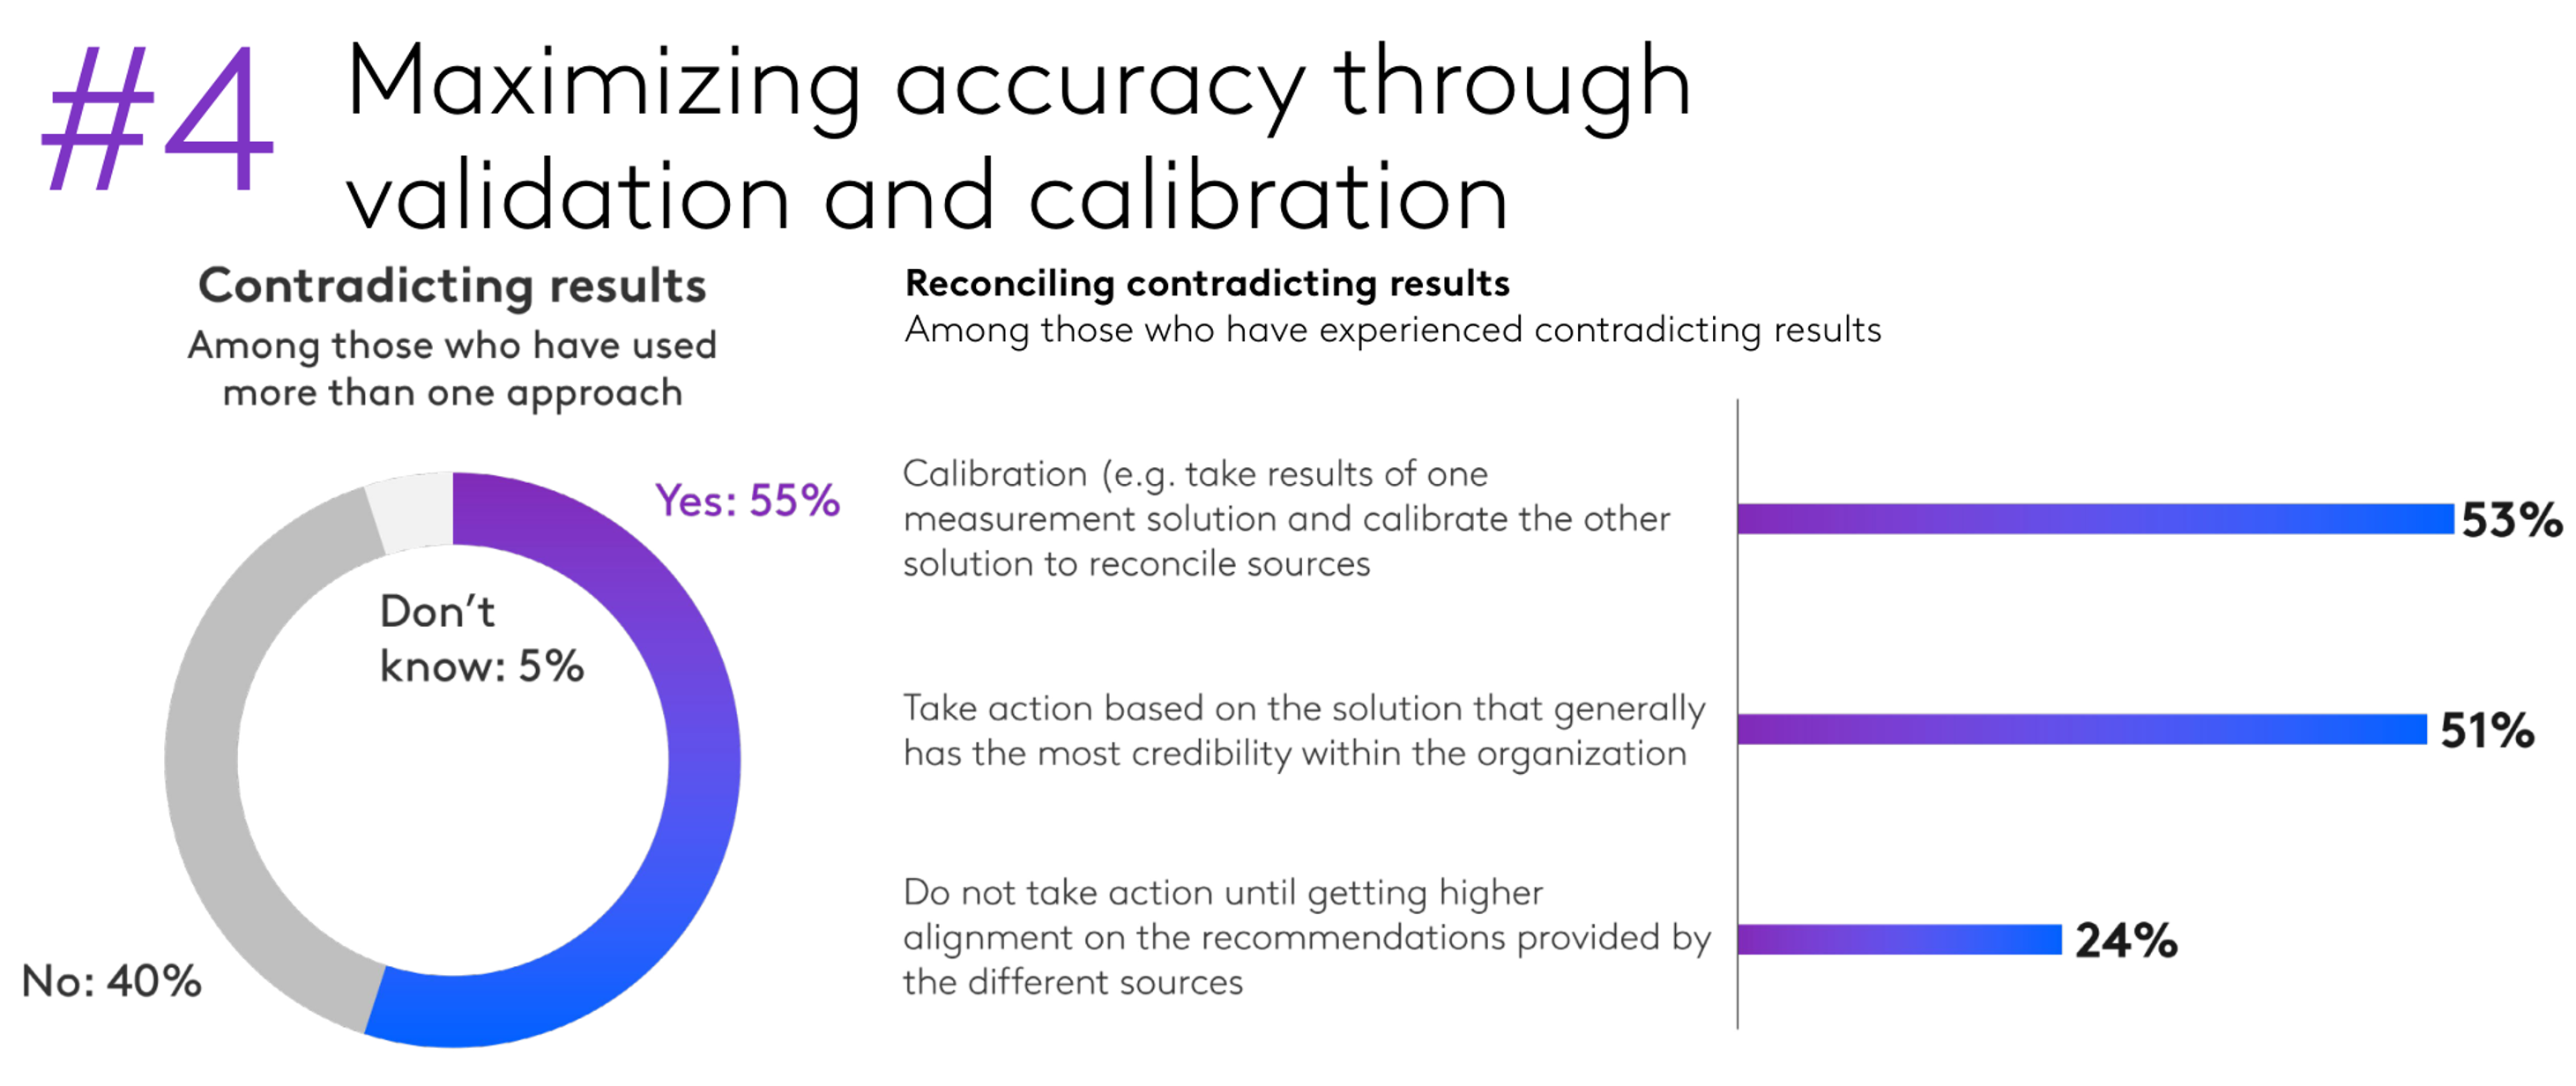
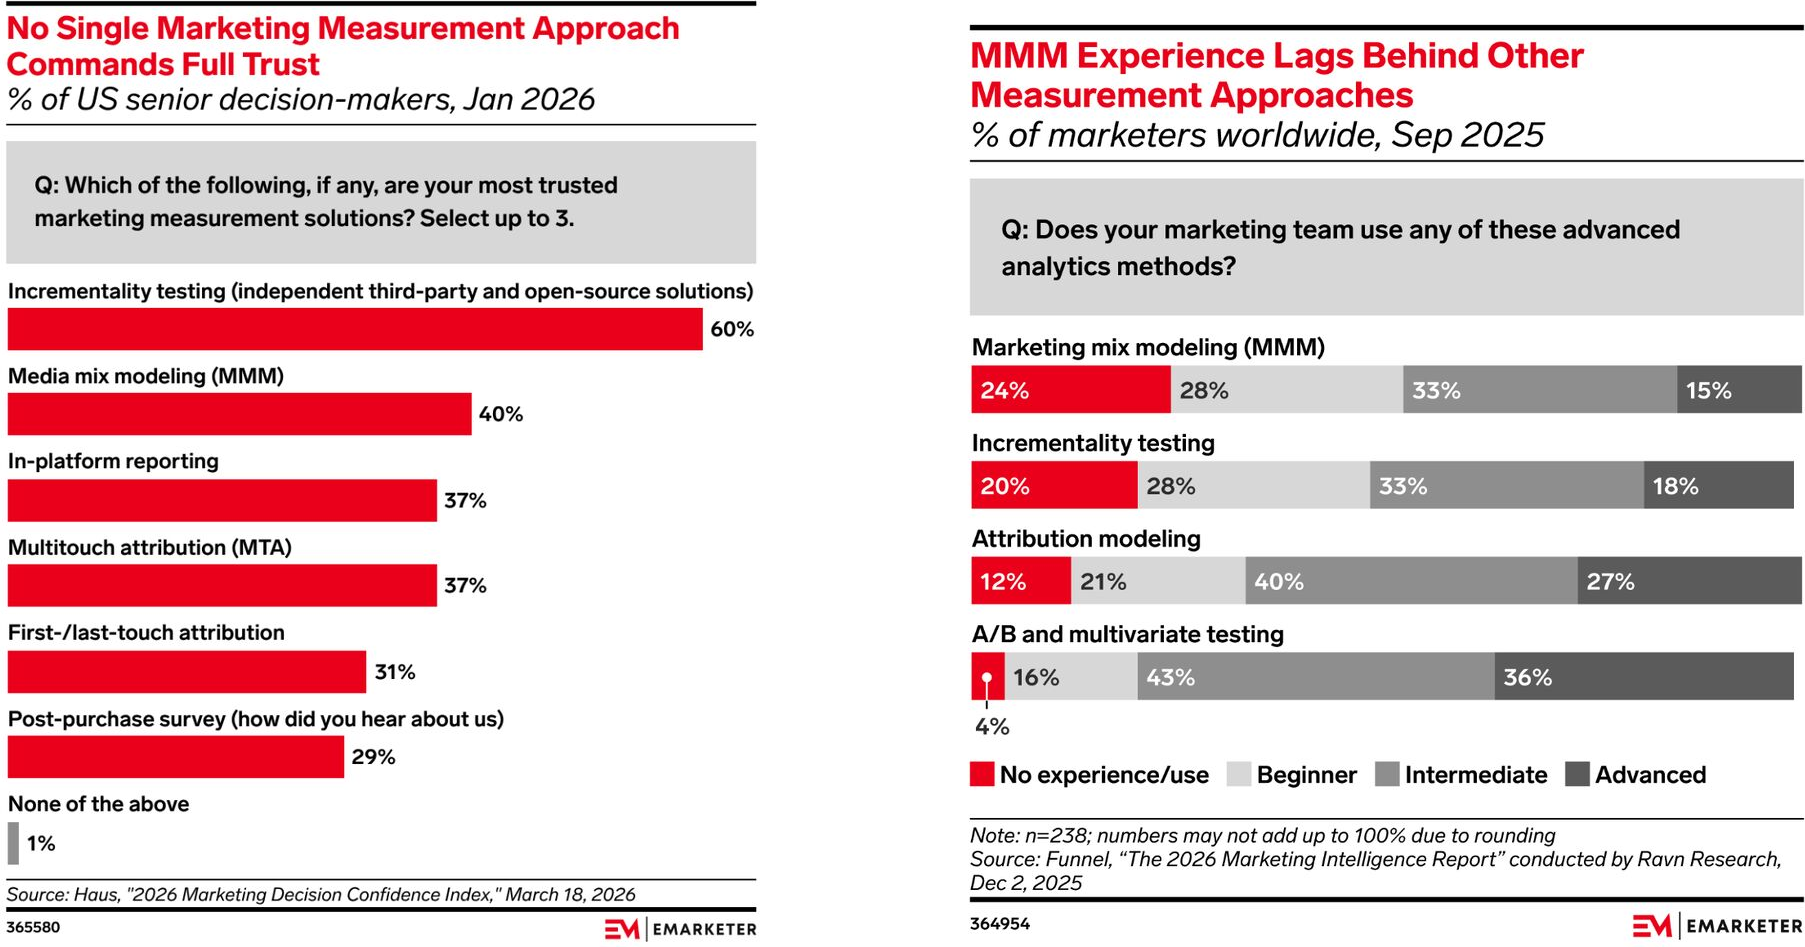
2024 Ad Measurement Trends
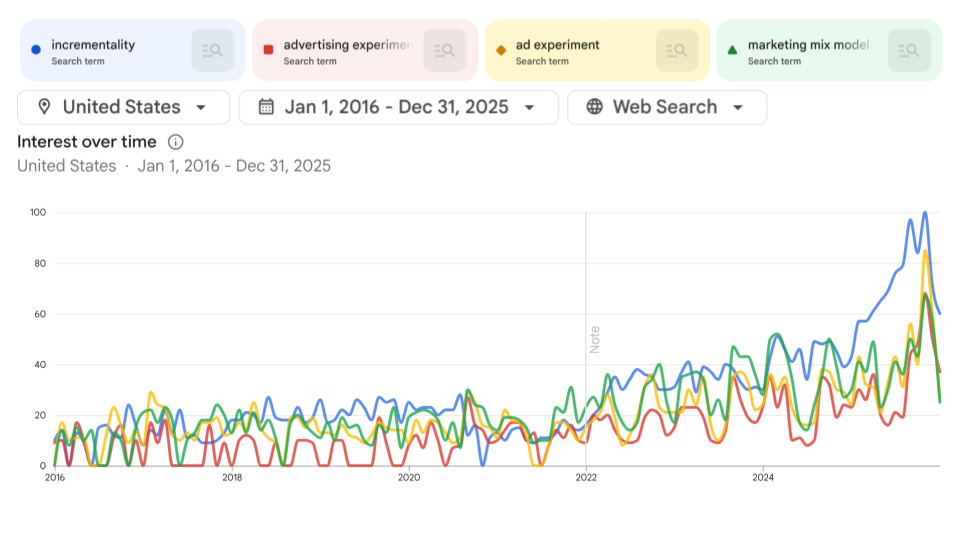
Ad Experiments in GTrends and Buy-side Surveys
Measurement of What?


Ad Measurement
- Advertising measurement quantifies ad delivery, exposure and outcomes to improve advertising efforts
- Our focus here is on outcomes/conversions, as these inform future budget decisions
- Delivery and exposure matter most for brand ads. Principles include independence and transparency in measurement; these must be checked, cannot be assumed
- Advertising measurement is hard because ad effects depend on ad content, context, timing, targeting, current market conditions, ad prices, past advertising & past outcomes—all of which change
- Shooting at a moving target
- Advertising measurement is expensive:
must directly inform future choices

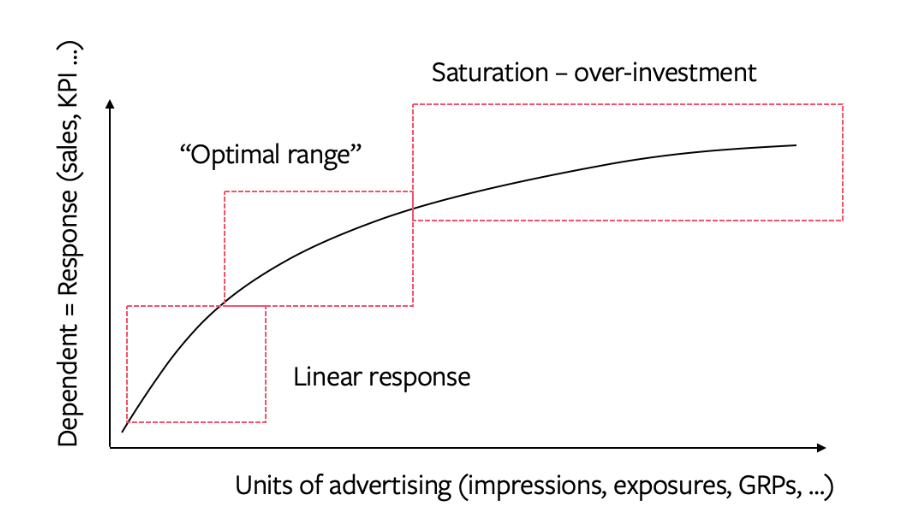
Diminishing Returns
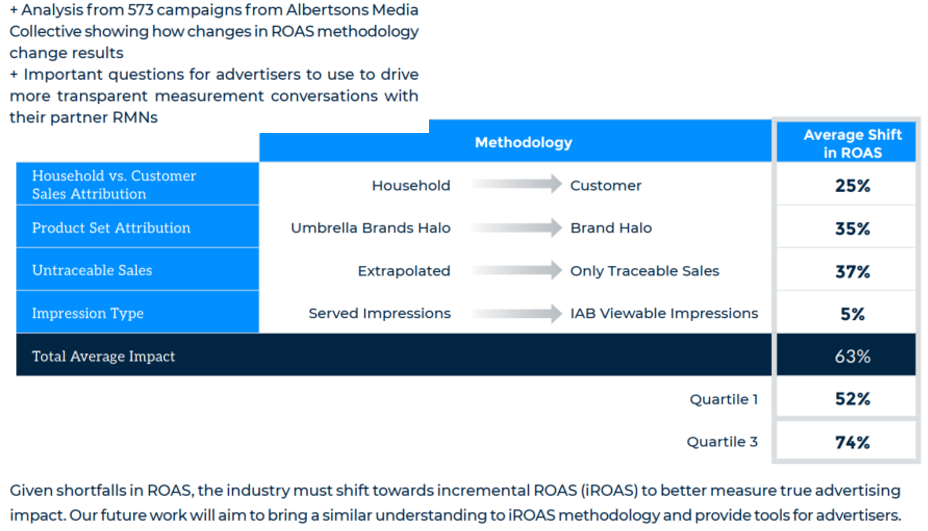
Albertsons: ROAS Varies with Measurement Choices
Using mROAS to Reallocate Spending
- MMM fits a sales response curve per channel; mROAS is the slope at current spend, i.e., revenue from the next ad dollar
- ROAS maximization requires harmonizing mROAS across channels
- Estimation error makes this an uncertain exercise

- Theory says: Max profits by spending until avg. cont. * mROAS = 1 in all channels, but practice is more complicated than that
Problem 2 with Corr(ad,sales)
- How do most marketers set ad budgets? Top 2 ways historically:
- Percentage of sales method, e.g. 1%, 3% or 6%
- Ads:sales ratios are often measured for benchmarking
- Competitive parity
- …others…
- Percentage of sales method, e.g. 1%, 3% or 6%
- Do you see the problem here?
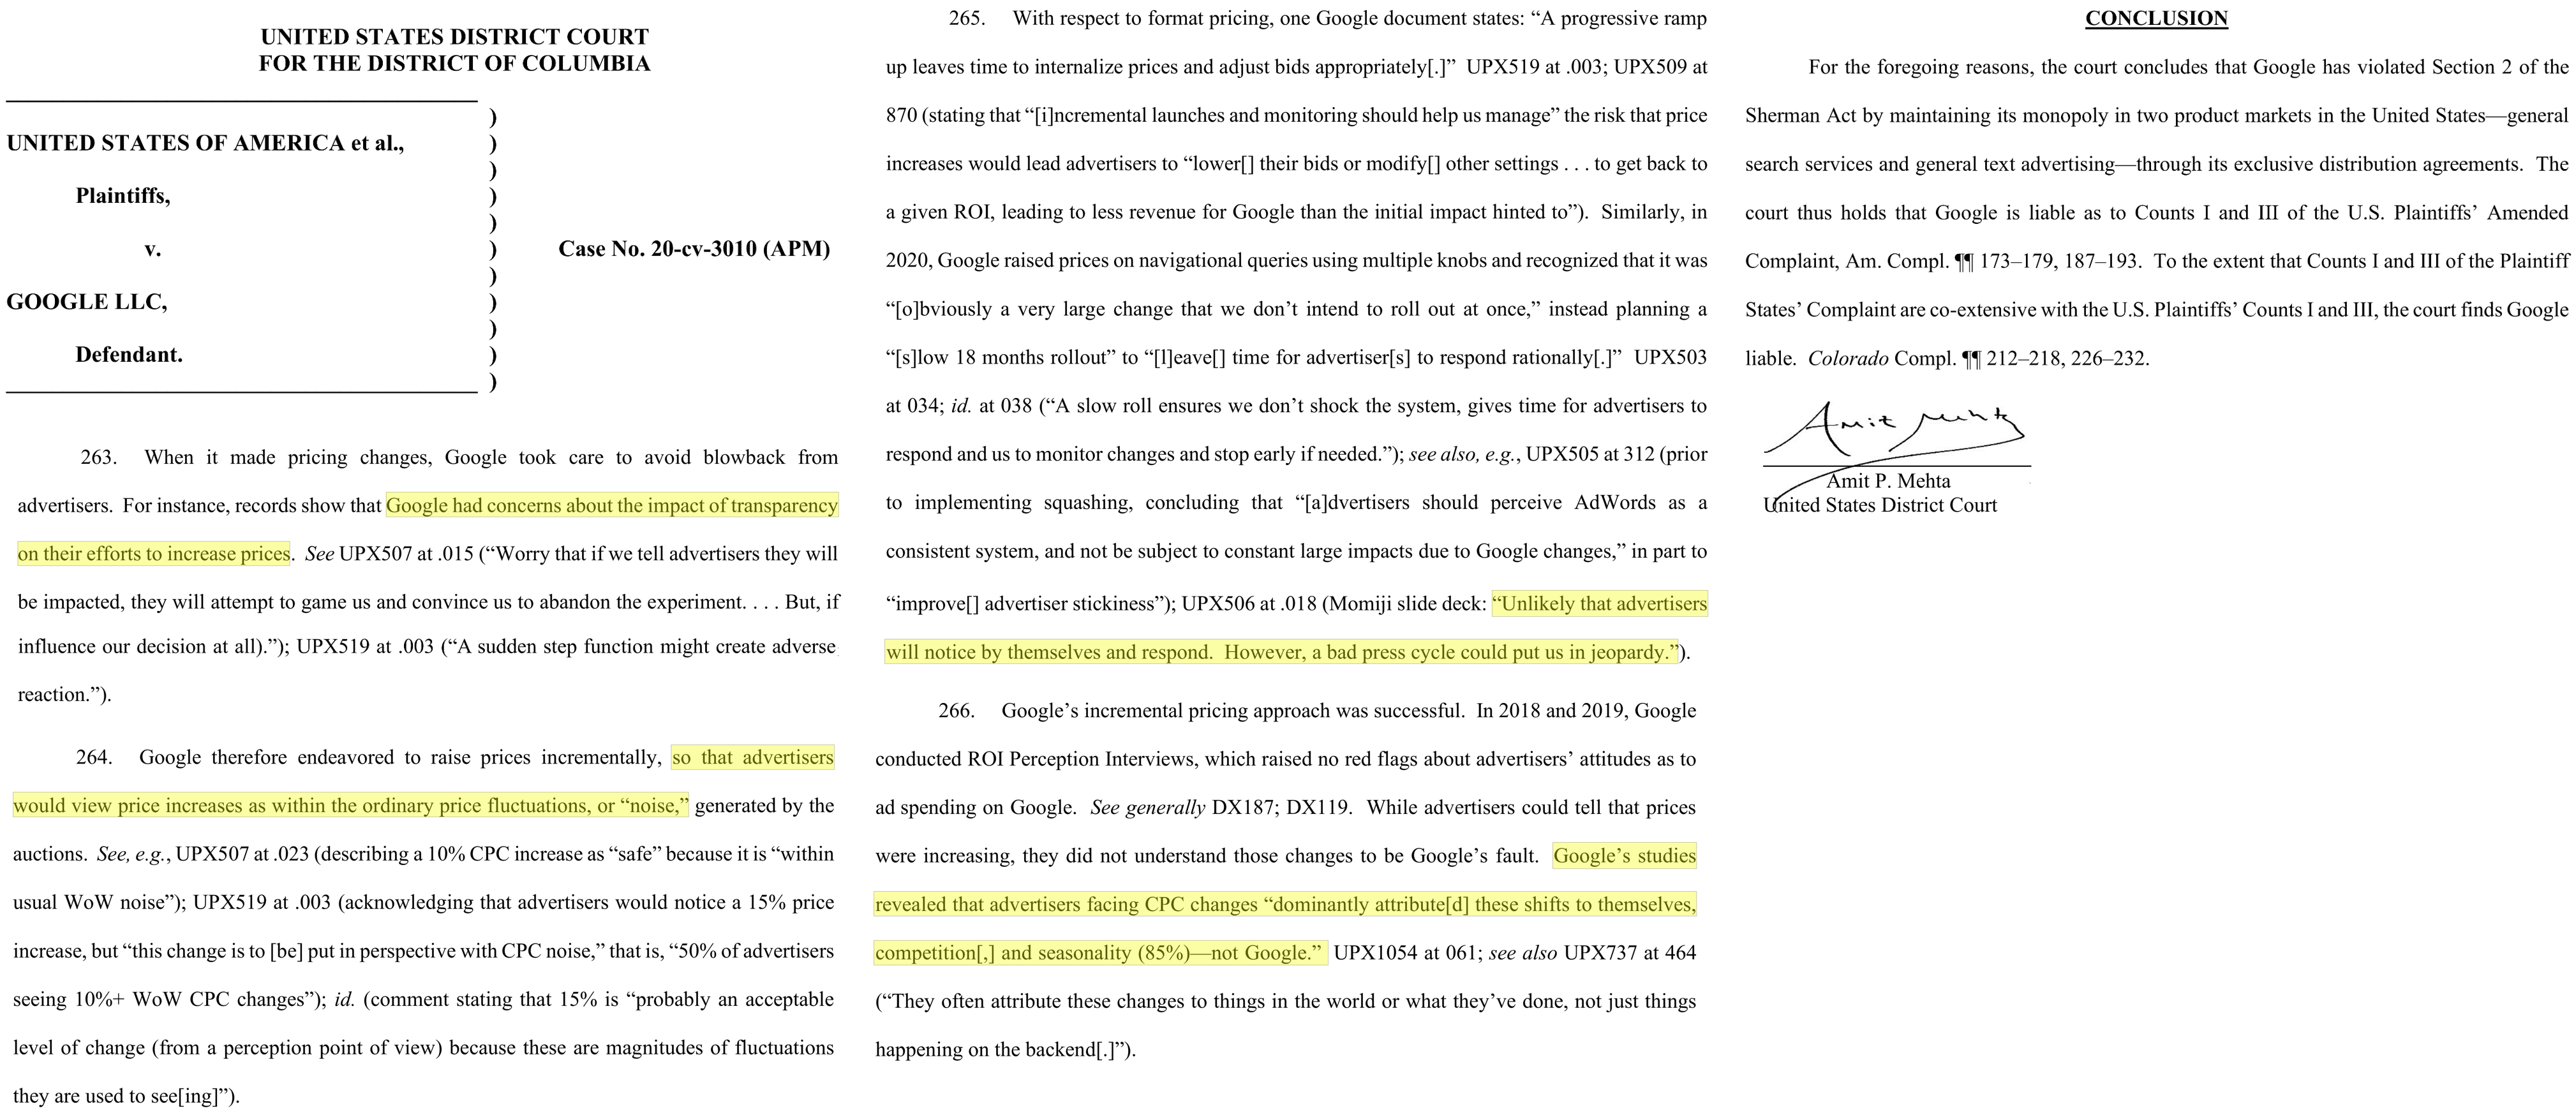
U.S. v Google (2024, Search Case)
Does Corr(ad,sales) Work?
Why Are Some Teams OK with Corr(ad,sales)?
- Some worry that if ads go to zero → sales go to zero
- For small firms or new products, without other marketing channels, this may be good logic
- However, premise implies deeper problems, i.e. need to diversify marketing efforts and find cheaper sources of sales
- Plus, we can run experiments without setting ads to zero, e.g. test 50% vs. 150%
- Some firms assume that correlations indicate direction of causal results
- The guy in the truck bed is pushing forwards right?
- Biased estimates might lead to unbiased decisions (key word: “might”)
- But direction is only part of the picture; what about effect size?
- CFO and CMO negotiate ad budget
- CFO asks for proof that ads work
- CMO asks ad agencies, platforms & marketing team for proof
- CMO sends proof to CFO; We all carry on
- Should ad measurement team report to CFO, CMO, or both?

Why Are Some Teams OK with Corr(ad,sales)?
- Managing analytics well requires skill and discipline
- Managers must integrate correlational and causal analyses when making decisions
- Analysts must have causal inference skillsets
- Organization must tolerate failure in search of data-driven incremental improvements
- How many shops go back and check their ex-ante predictions? What are the internal incentives for accuracy?
- Platforms often provide correlational ad/sales estimates
- Which are larger, correlational or experimental ad effect estimates?
- Which one might many client marketers prefer?
- “Nobody ever got fired for buying [___].” [Amazon, Google, Meta]
- Historically, agencies usually estimated ROAS
- Agency compensation usually relies on ad spending, not incremental sales;
principal/agent problems are common - These days, more marketers have in-house agencies, and split work
- Agency compensation usually relies on ad spending, not incremental sales;
Diff-in-Diffs Helped Identify Cholera Cause
In the 1850s, an English doctor named John Snow suspected that cholera spread via food and drink, rather than the popular theory of airborne transmission. Snow realized a natural experiment offered identification.

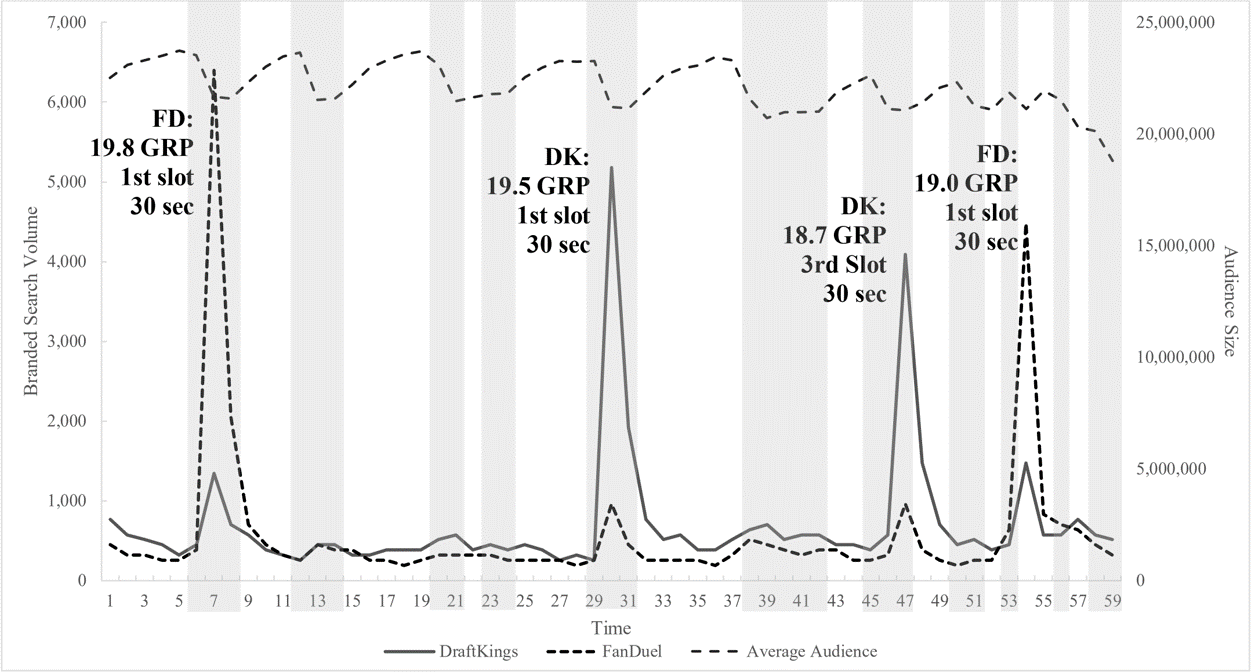
TV Ad Effects on Google Search
Ad/Sales: Quasi-experiments (2)
See also Shapiro (2018)
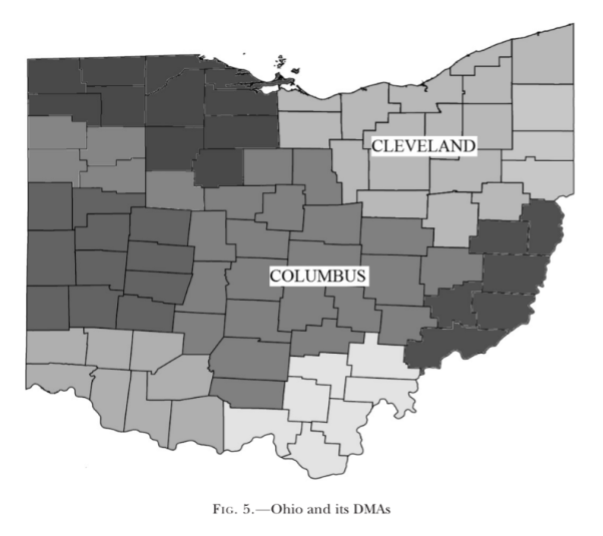
Who Tests the Most?
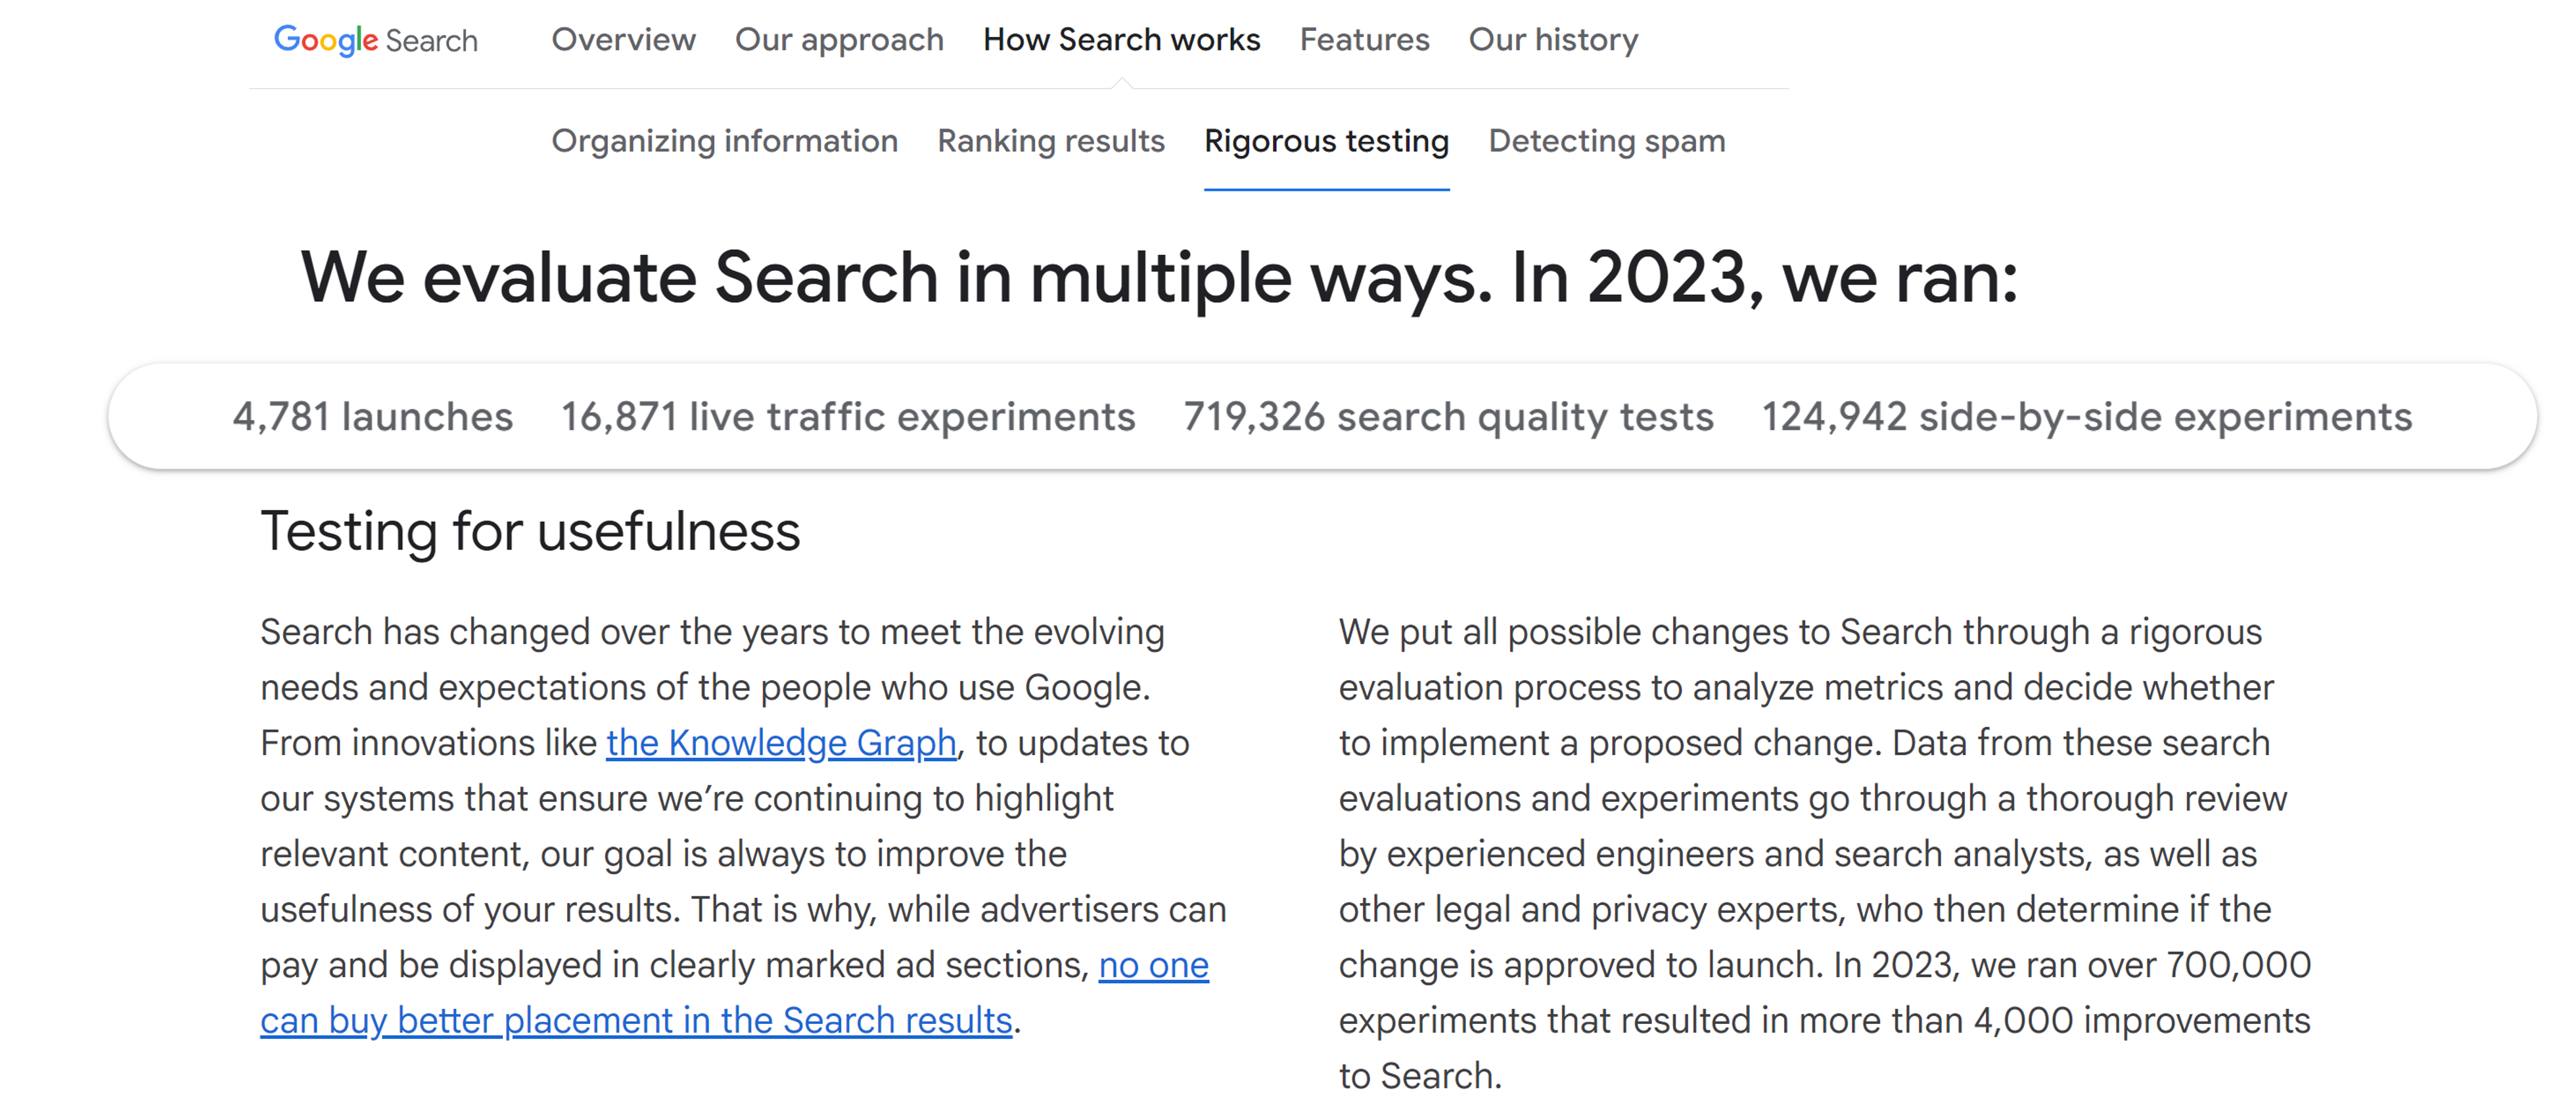
Advertising Experiment Frequency
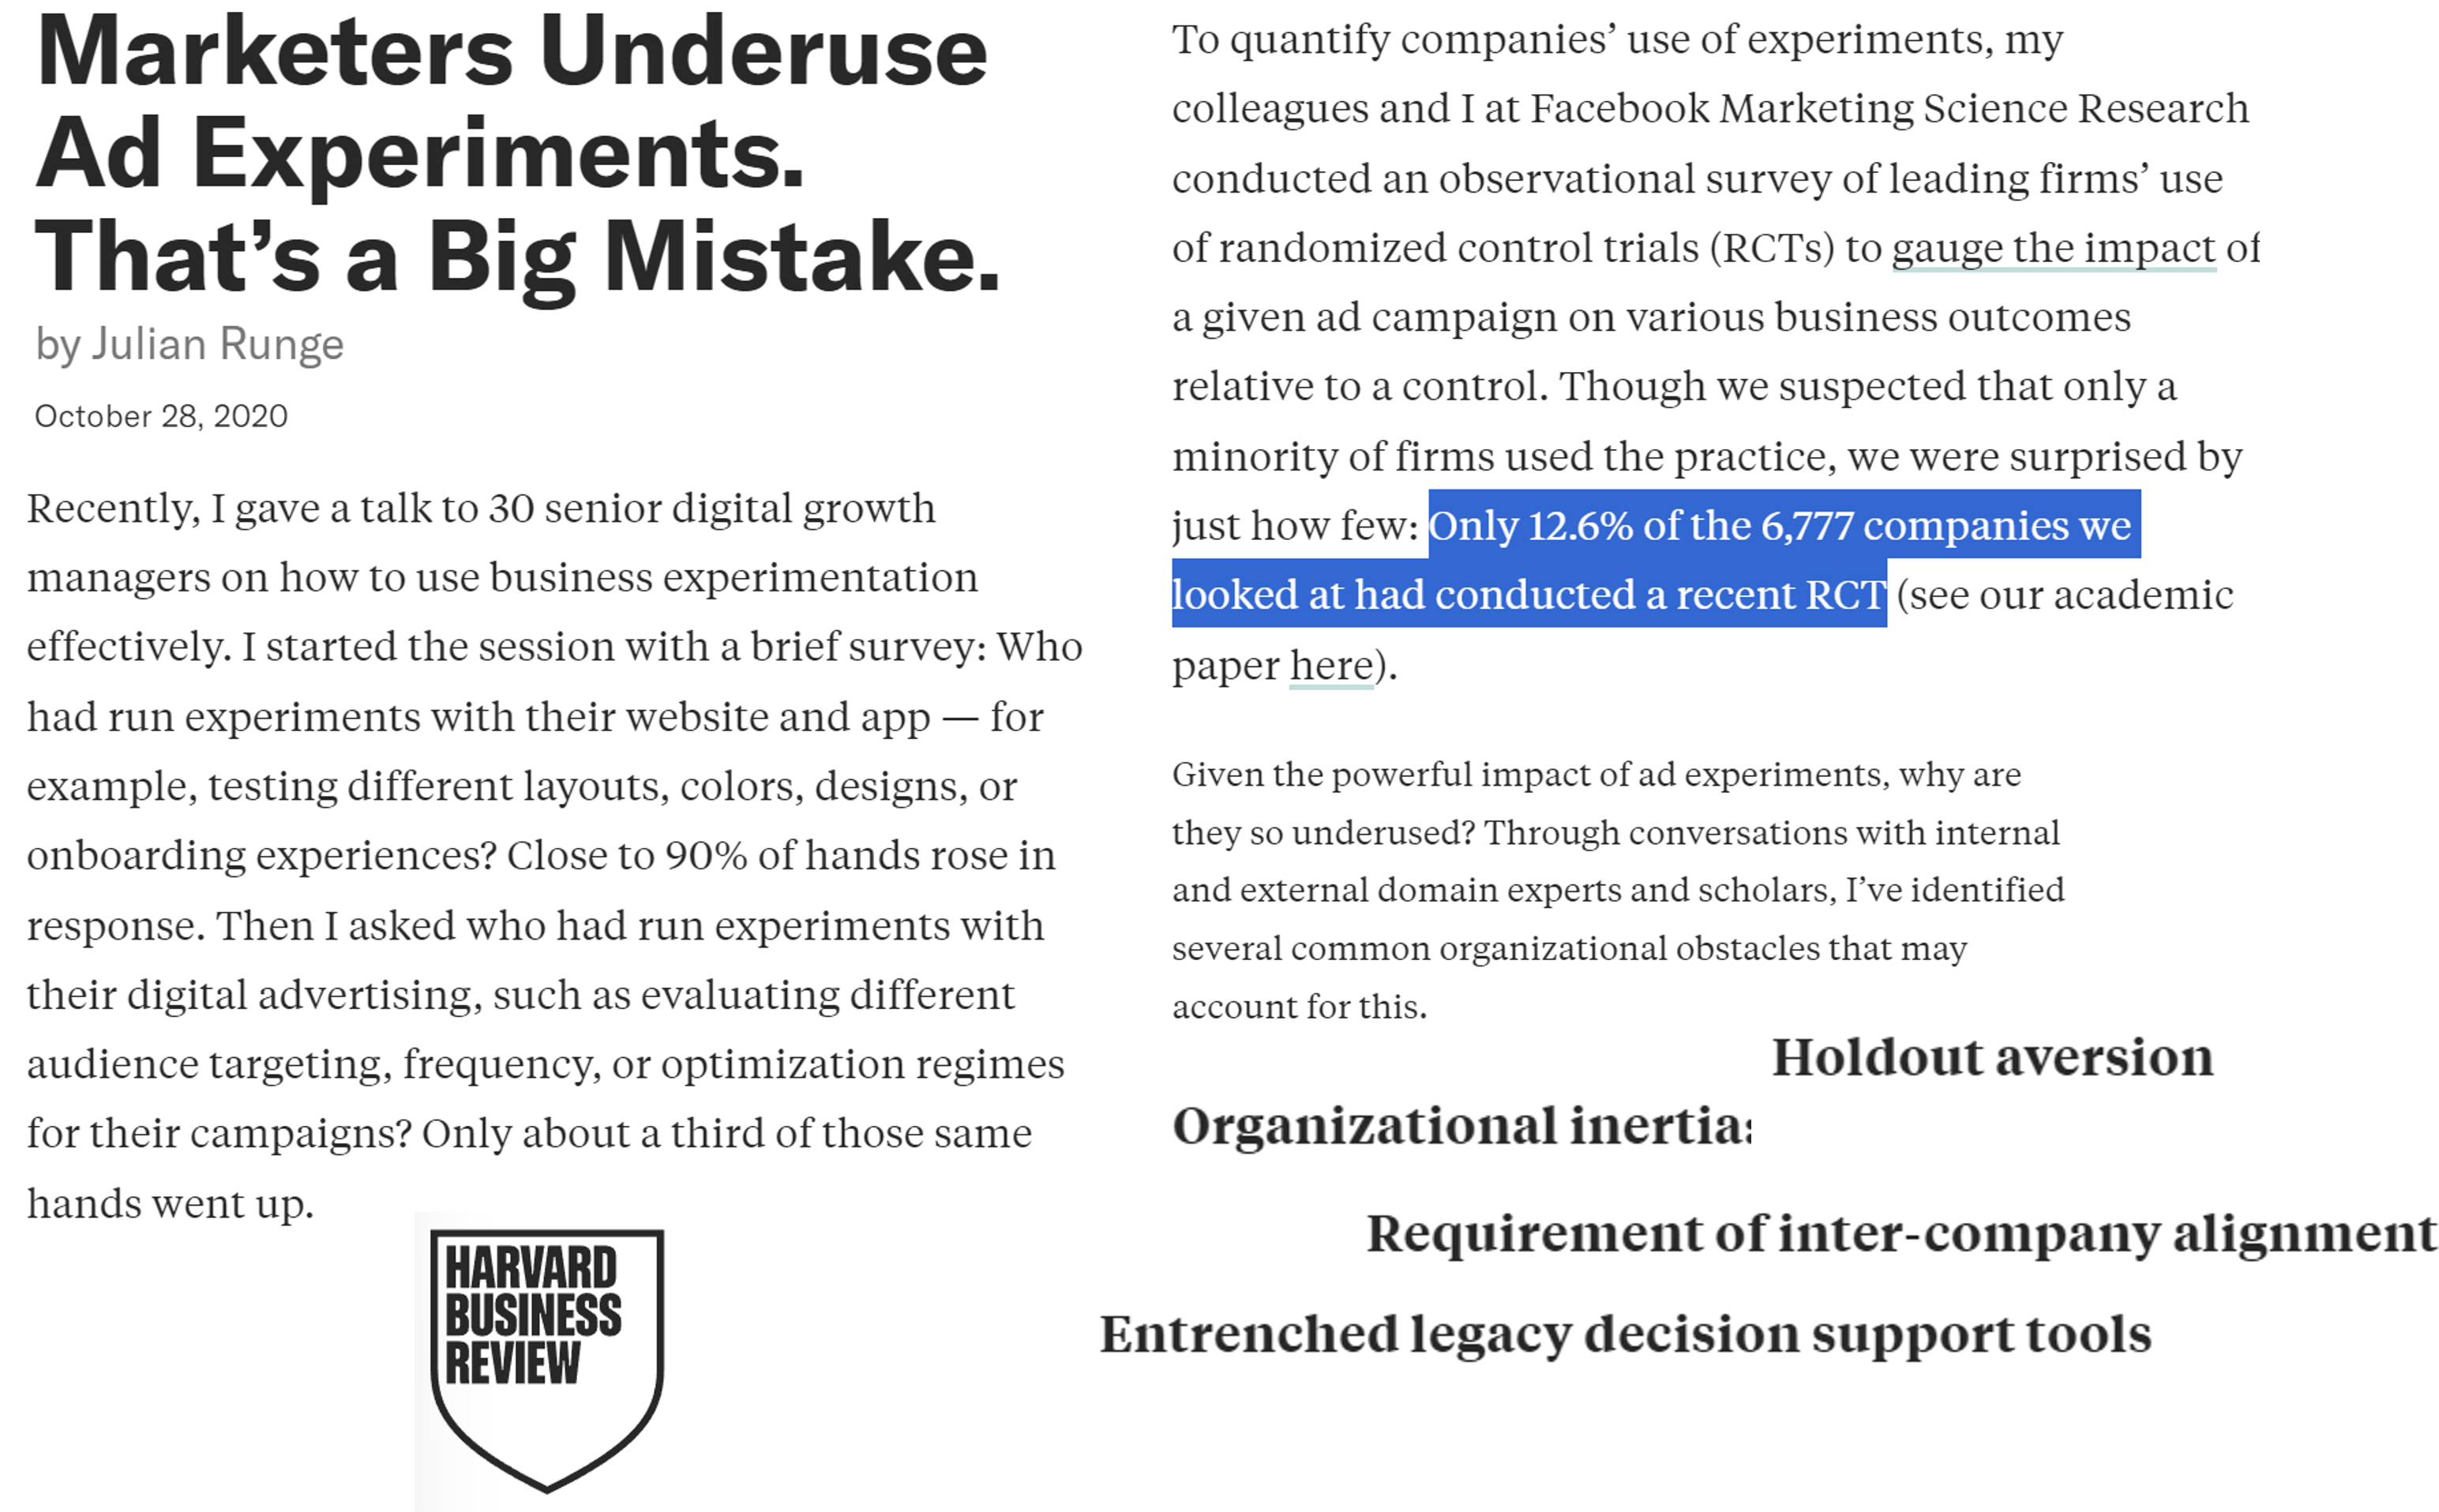
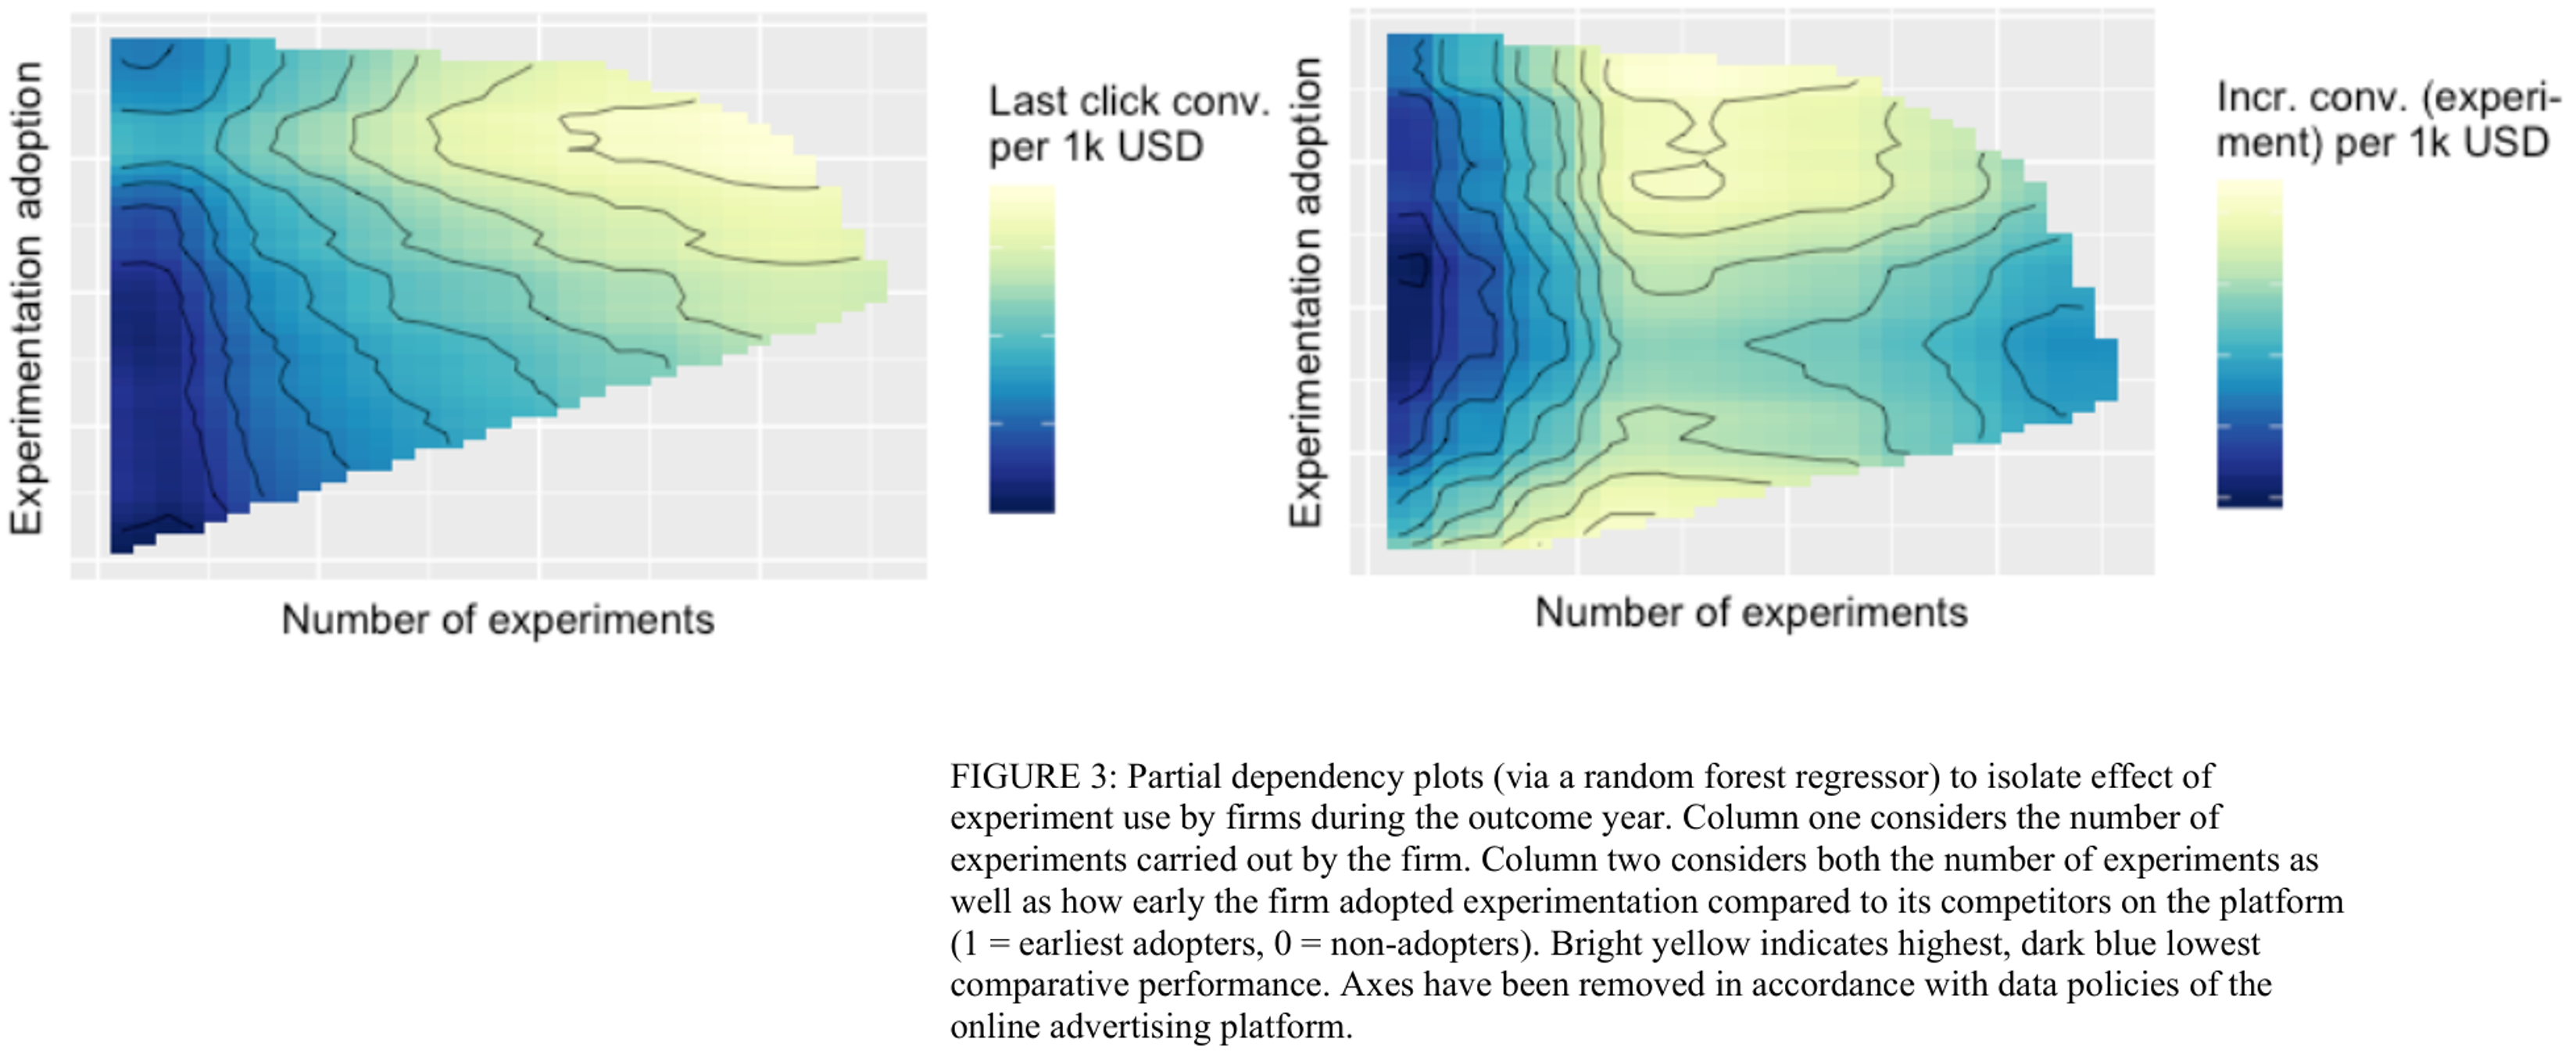
Advertising Experiment Effectiveness
Integrating MMM with Causal Measurement
- Correlational methods are cheap & always-on; Experiments are credible but scarce & costly; Both are noisy; Measures will disagree
Using Experiments to Validate MMM Reallocations
- A natural first step is to validate correlational ad measurement with experiments
- Dropbox did this with small experiments in Canada, then a month-long full-US blackout on mobile and search, which showed that search attribution was 117% too high
- Mobile-trial starts fell 5%, but earnings guidance increased, citing performance marketing efficiency as a key driver
- More generally, when MMM recommends a change, run a test alongside implementing the change, and compare the resulting test result to the MMM prediction c.i.
- This tests MMM output’s predictive validity
![]()
What would you do?

Takeaways
Fundamental Problem of Causal Inference: We can’t observe all data needed to optimize actions. This is a missing-data problem, not a modeling problem.
- Common remedies: Experiments, Quasi-experiments, Correlations, Triangulate; Ignore
Incrementality-based advertising measurement is a generational shift improving marketing profits, but we still have a long way to go
Experiments are the gold standard, but are costly and challenging to design, implement and act on
Ad effects are subtle but that does not imply unprofitable. Measurement is challenging but required to optimize profits

Resources for Further Study
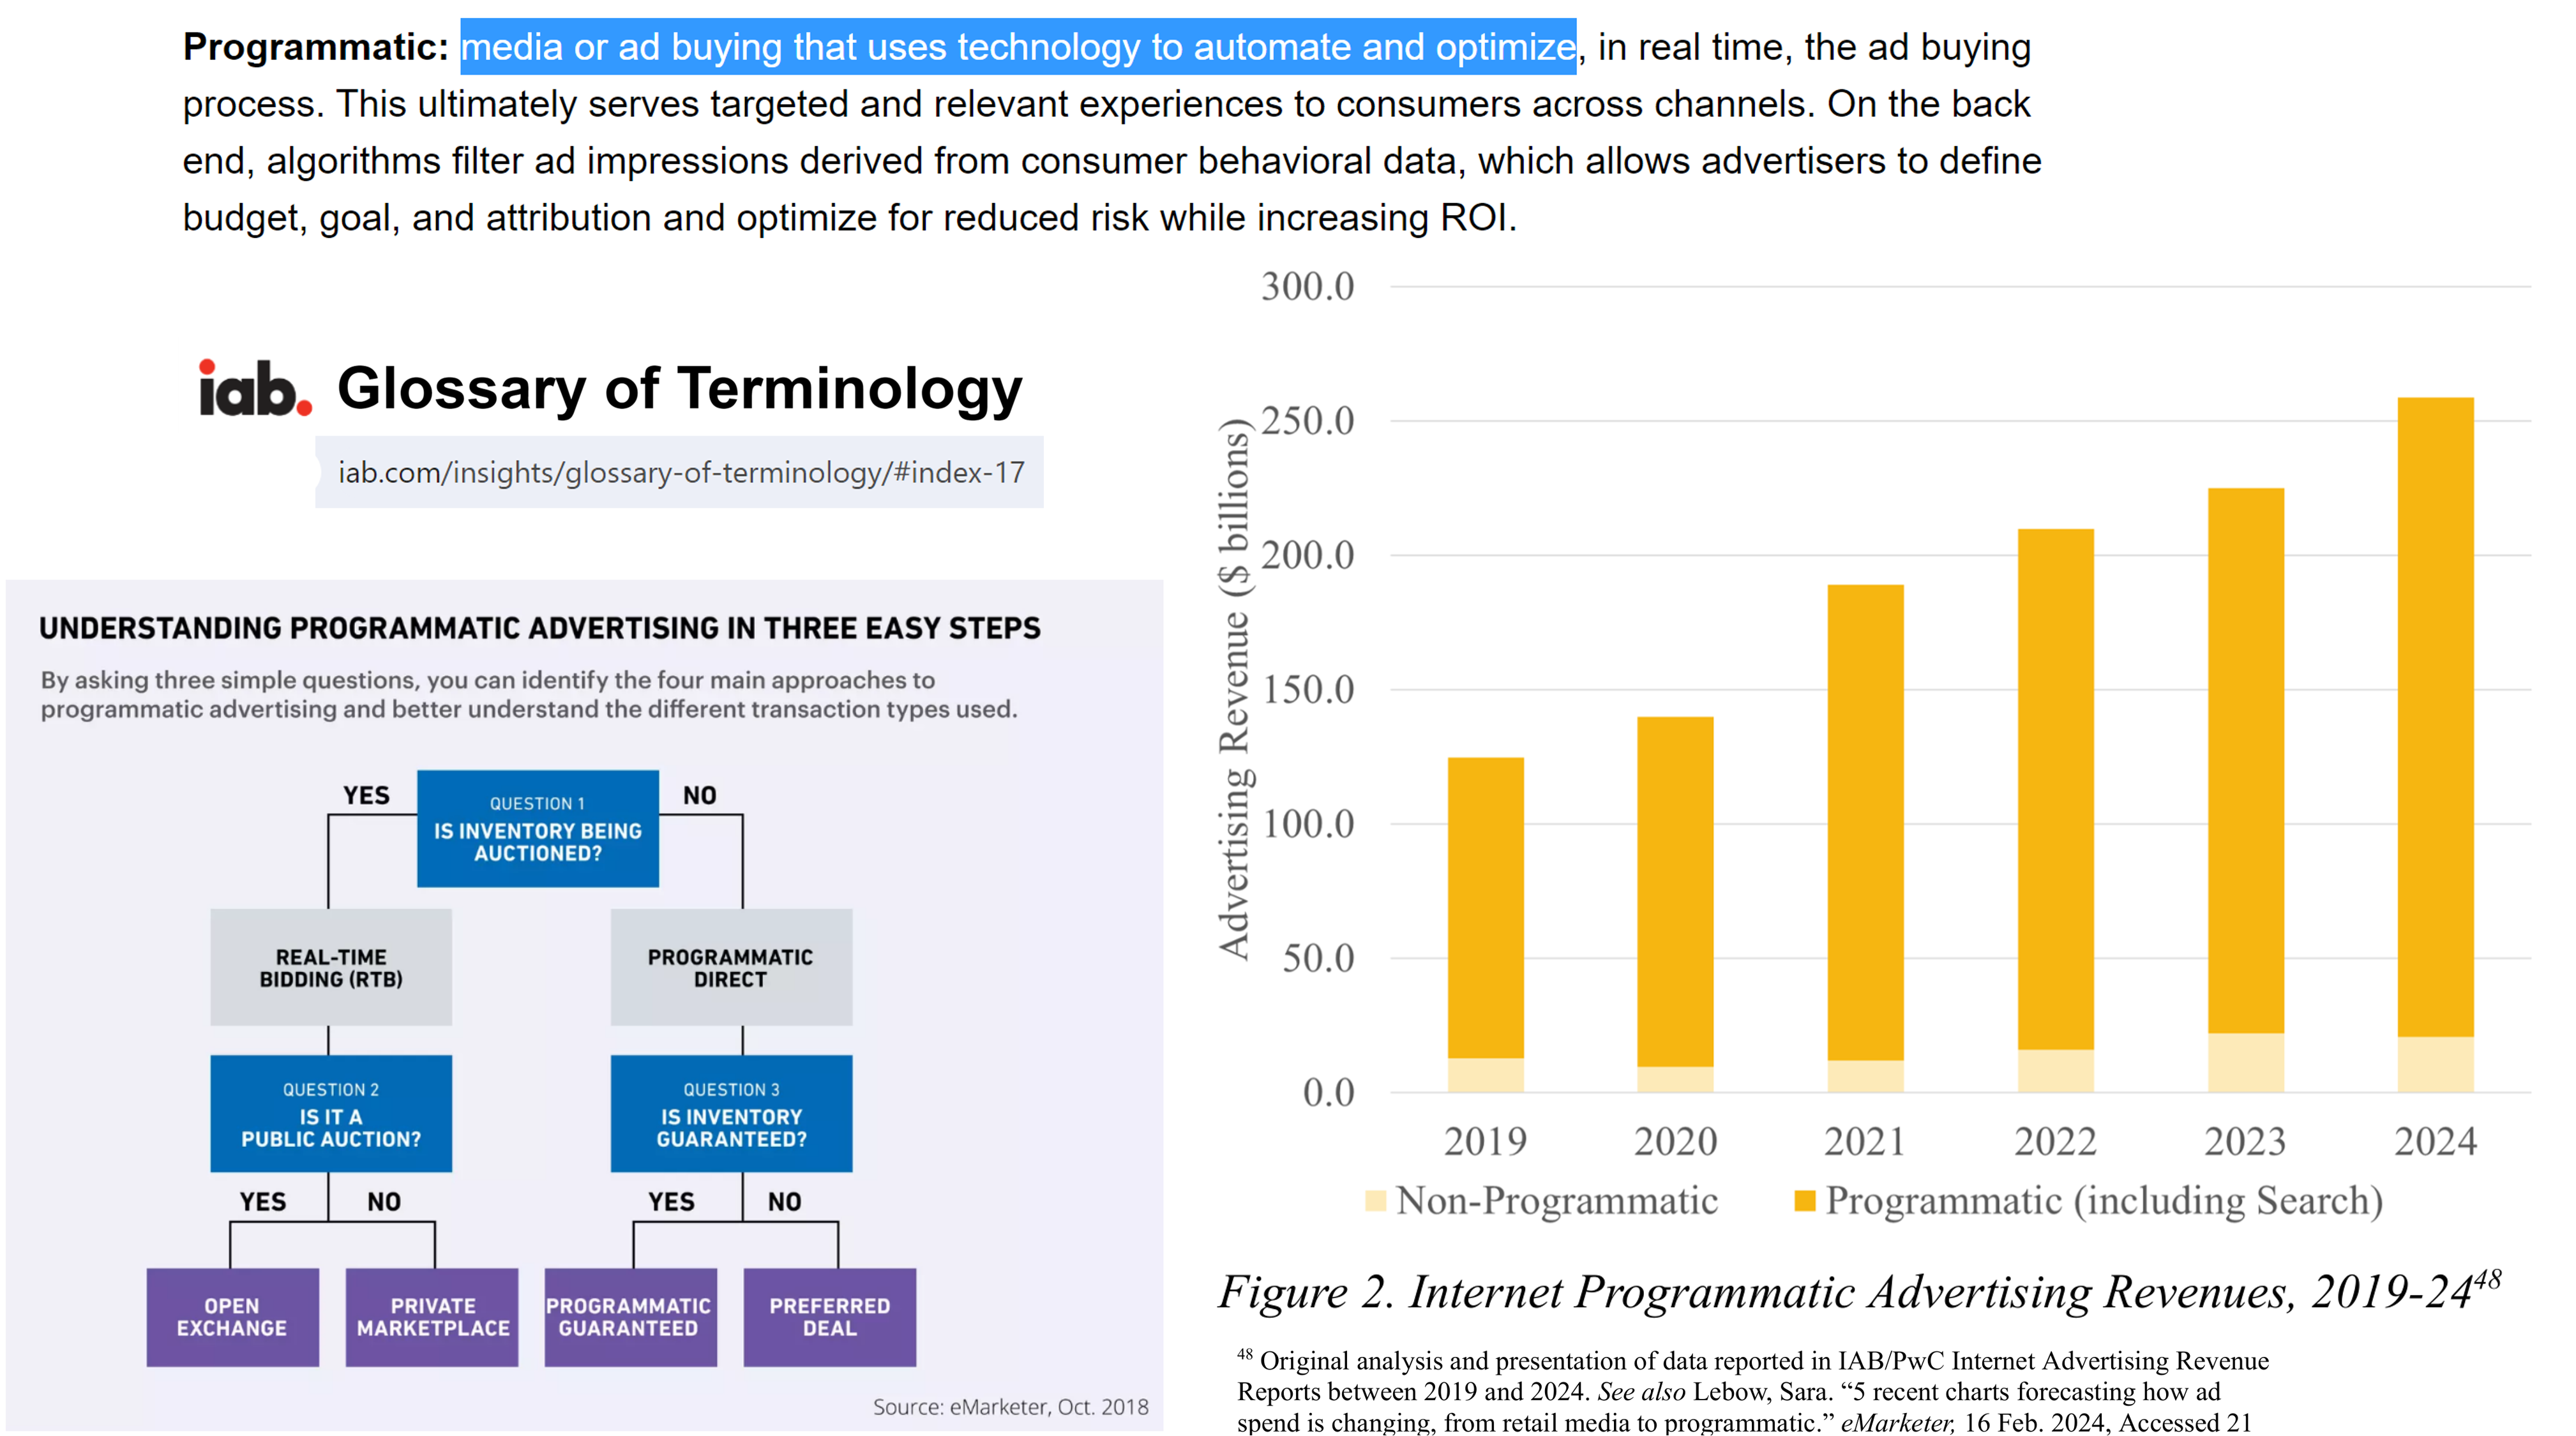
Paparo (2025): Insider’s account of programmatic advertising development from 2000-2025
Content providers to follow: Adexchanger, Adweek, Digiday, Marketecture
Project Eidos: IAB’s effort to define admeas principles, standards, and frameworks
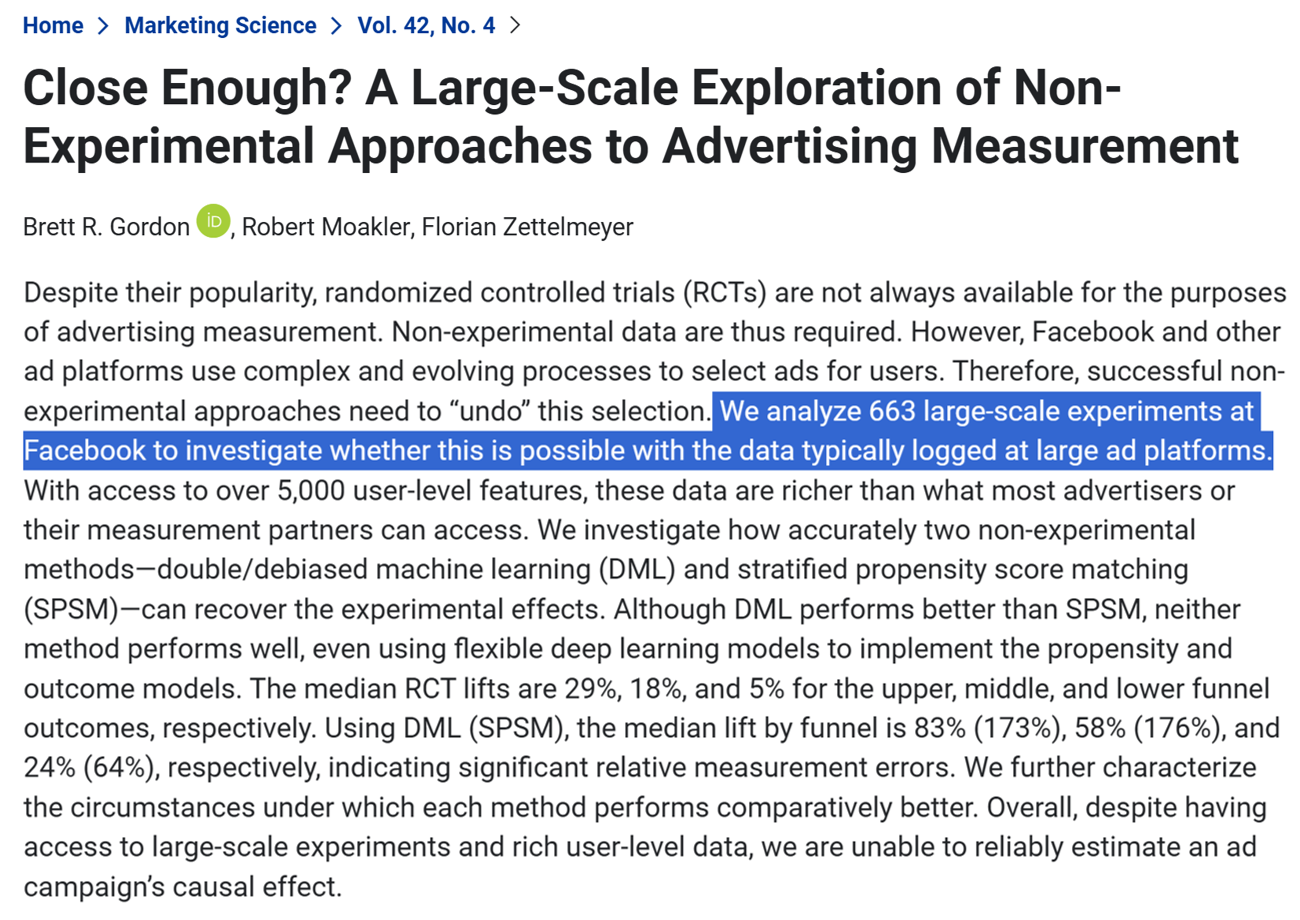
Gordon et al. (2020): Discusses iROAS estimation challenges and remedies
Dew et al. (2024): Smart discussion of key MMM assumptions
Luca & Bazerman (2020): Goes deep on digital test-and-learn considerations
Barajas et al. (2021): Online Advertising Incrementality Testing And Experimentation: Industry Practical Lessons

AdMeas, the Game