Customer Attributes
UCSD MGT 100 Week 02
Let’s reflect
- What is Market Segmentation by Qualtrics

Segmentation
- What is it
- Measurable, Accessible, Substantial, Actionable
Heterogeneity
A fancy way to say that consumers differ, e.g.
Product needs–usage intensity, frequency, context; loyalty
Demographics–often overrated as predictors of behavior
Psychographics–Orientation to Art, Status, Religion, Family, …
Location
Experience
Information
Attitudes
Differences often predict purchases, wtp, usage, satisfaction, retention, …
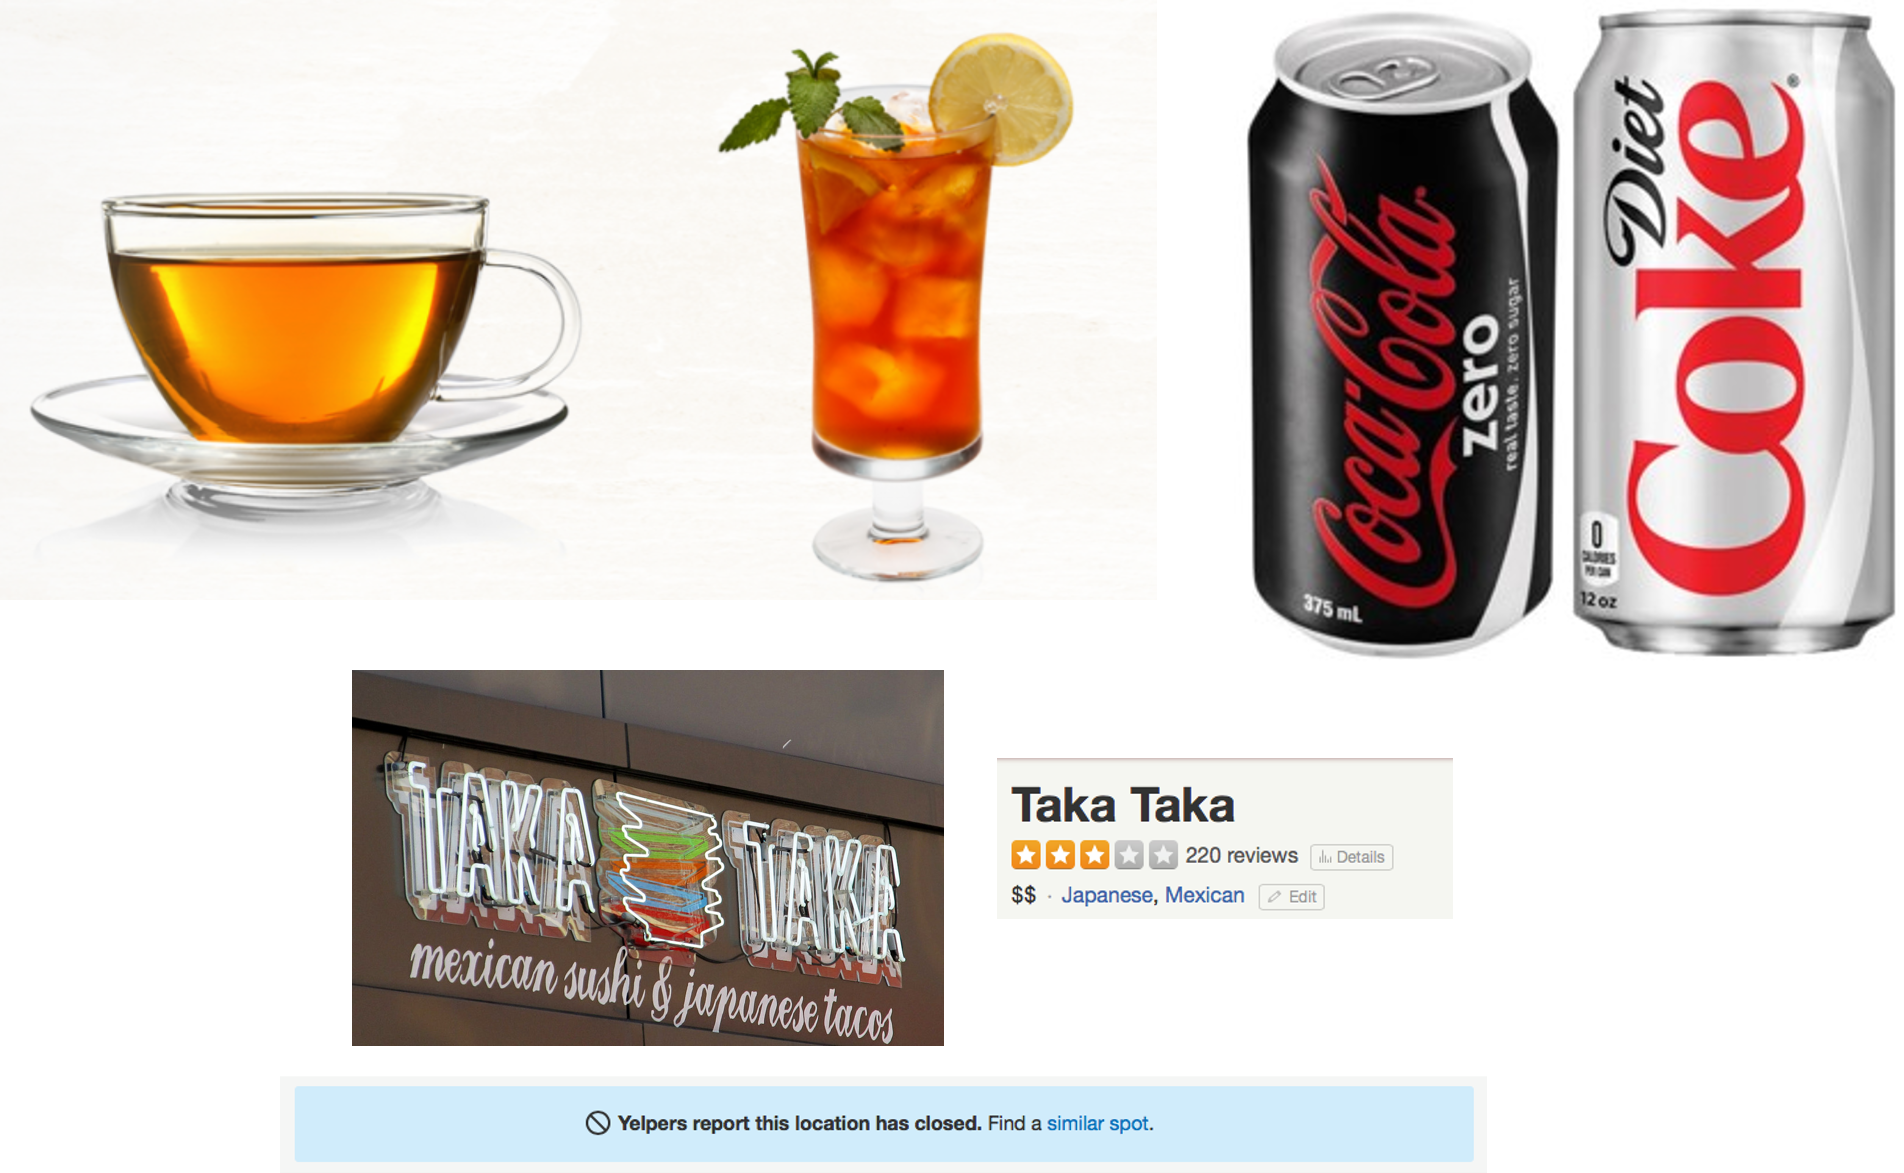
Market Segmentation
Segments: distinct customer groups with similar attributes within a segment, different attributes between segments
    - Fundamental since the 1960s
    - Numerous segmentation techniques exist; major recent improvements
    - Customer Response Profiles embody segments
    - B2B segments: customer needs, size, profitability, internal structure
Decision drivers: product attributes, extensions, bundling, packaging; advertising targeting, content, media; price discrimination, discounts; social media, loyalty programs, …
Segments should be Measurable in relation to firm objectives, Accessible, Substantial, Actionable
Segments in this class, ranked by size
Business Econ majors who won’t like Marketing
Business Econ majors who will like Marketing
Non-technical majors (ISIB, Biz Psych, Comm, etc)
Data Science, Computer Science, other technical majors
Segments inform our course content for 2 objectives:
    - Broad survey of analytics, customers and marketing topics

    - Deep dive into demand estimation with pointers to further learning
Measurable
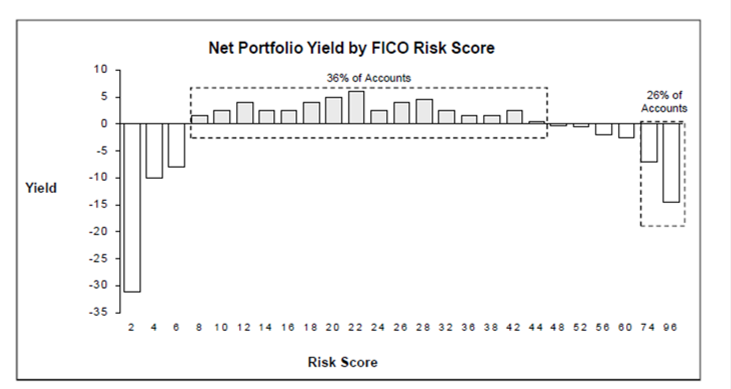
Substantial

Is segmenting by gender sexist?

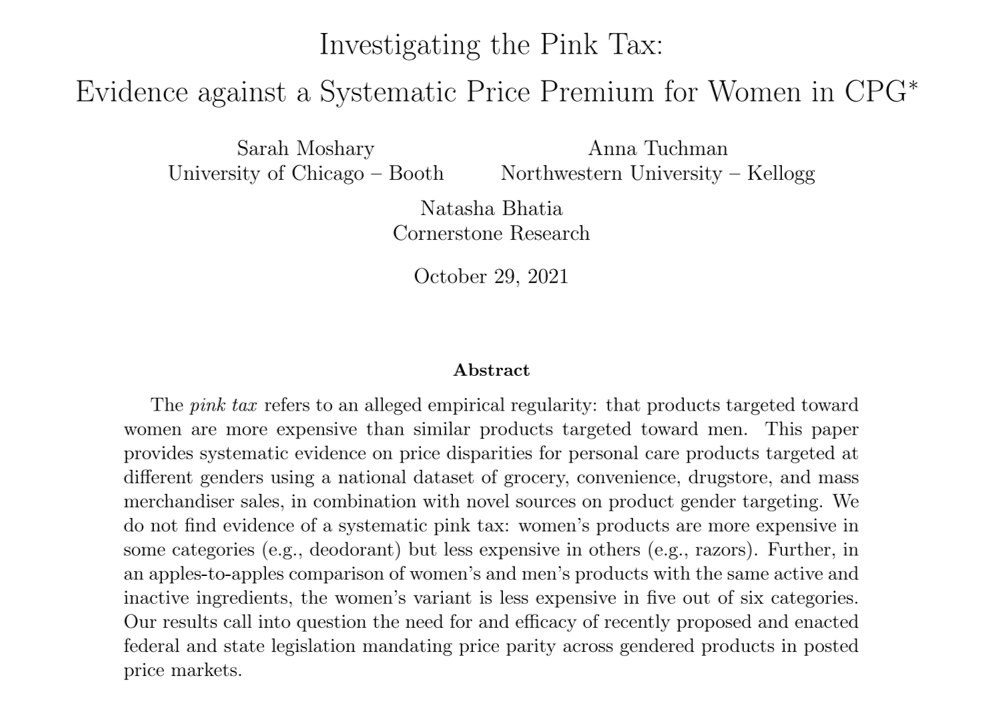
Customer demographics
In some markets– makeup, diapers, sports, shoes– demographics correlate strongly with behaviors
In most markets– smartphones, universities, software, cars– demographics correlate weakly with behaviors
Demographics don’t typically cause purchases, except when they predict real differences in customer needs
Why do we so often overrate demographics as predictors of behavior?
Segmentation in Action
- Who does it
- Browser users
- Why we keep it quiet
- Nearly every large business segments its markets

Firefox User Types
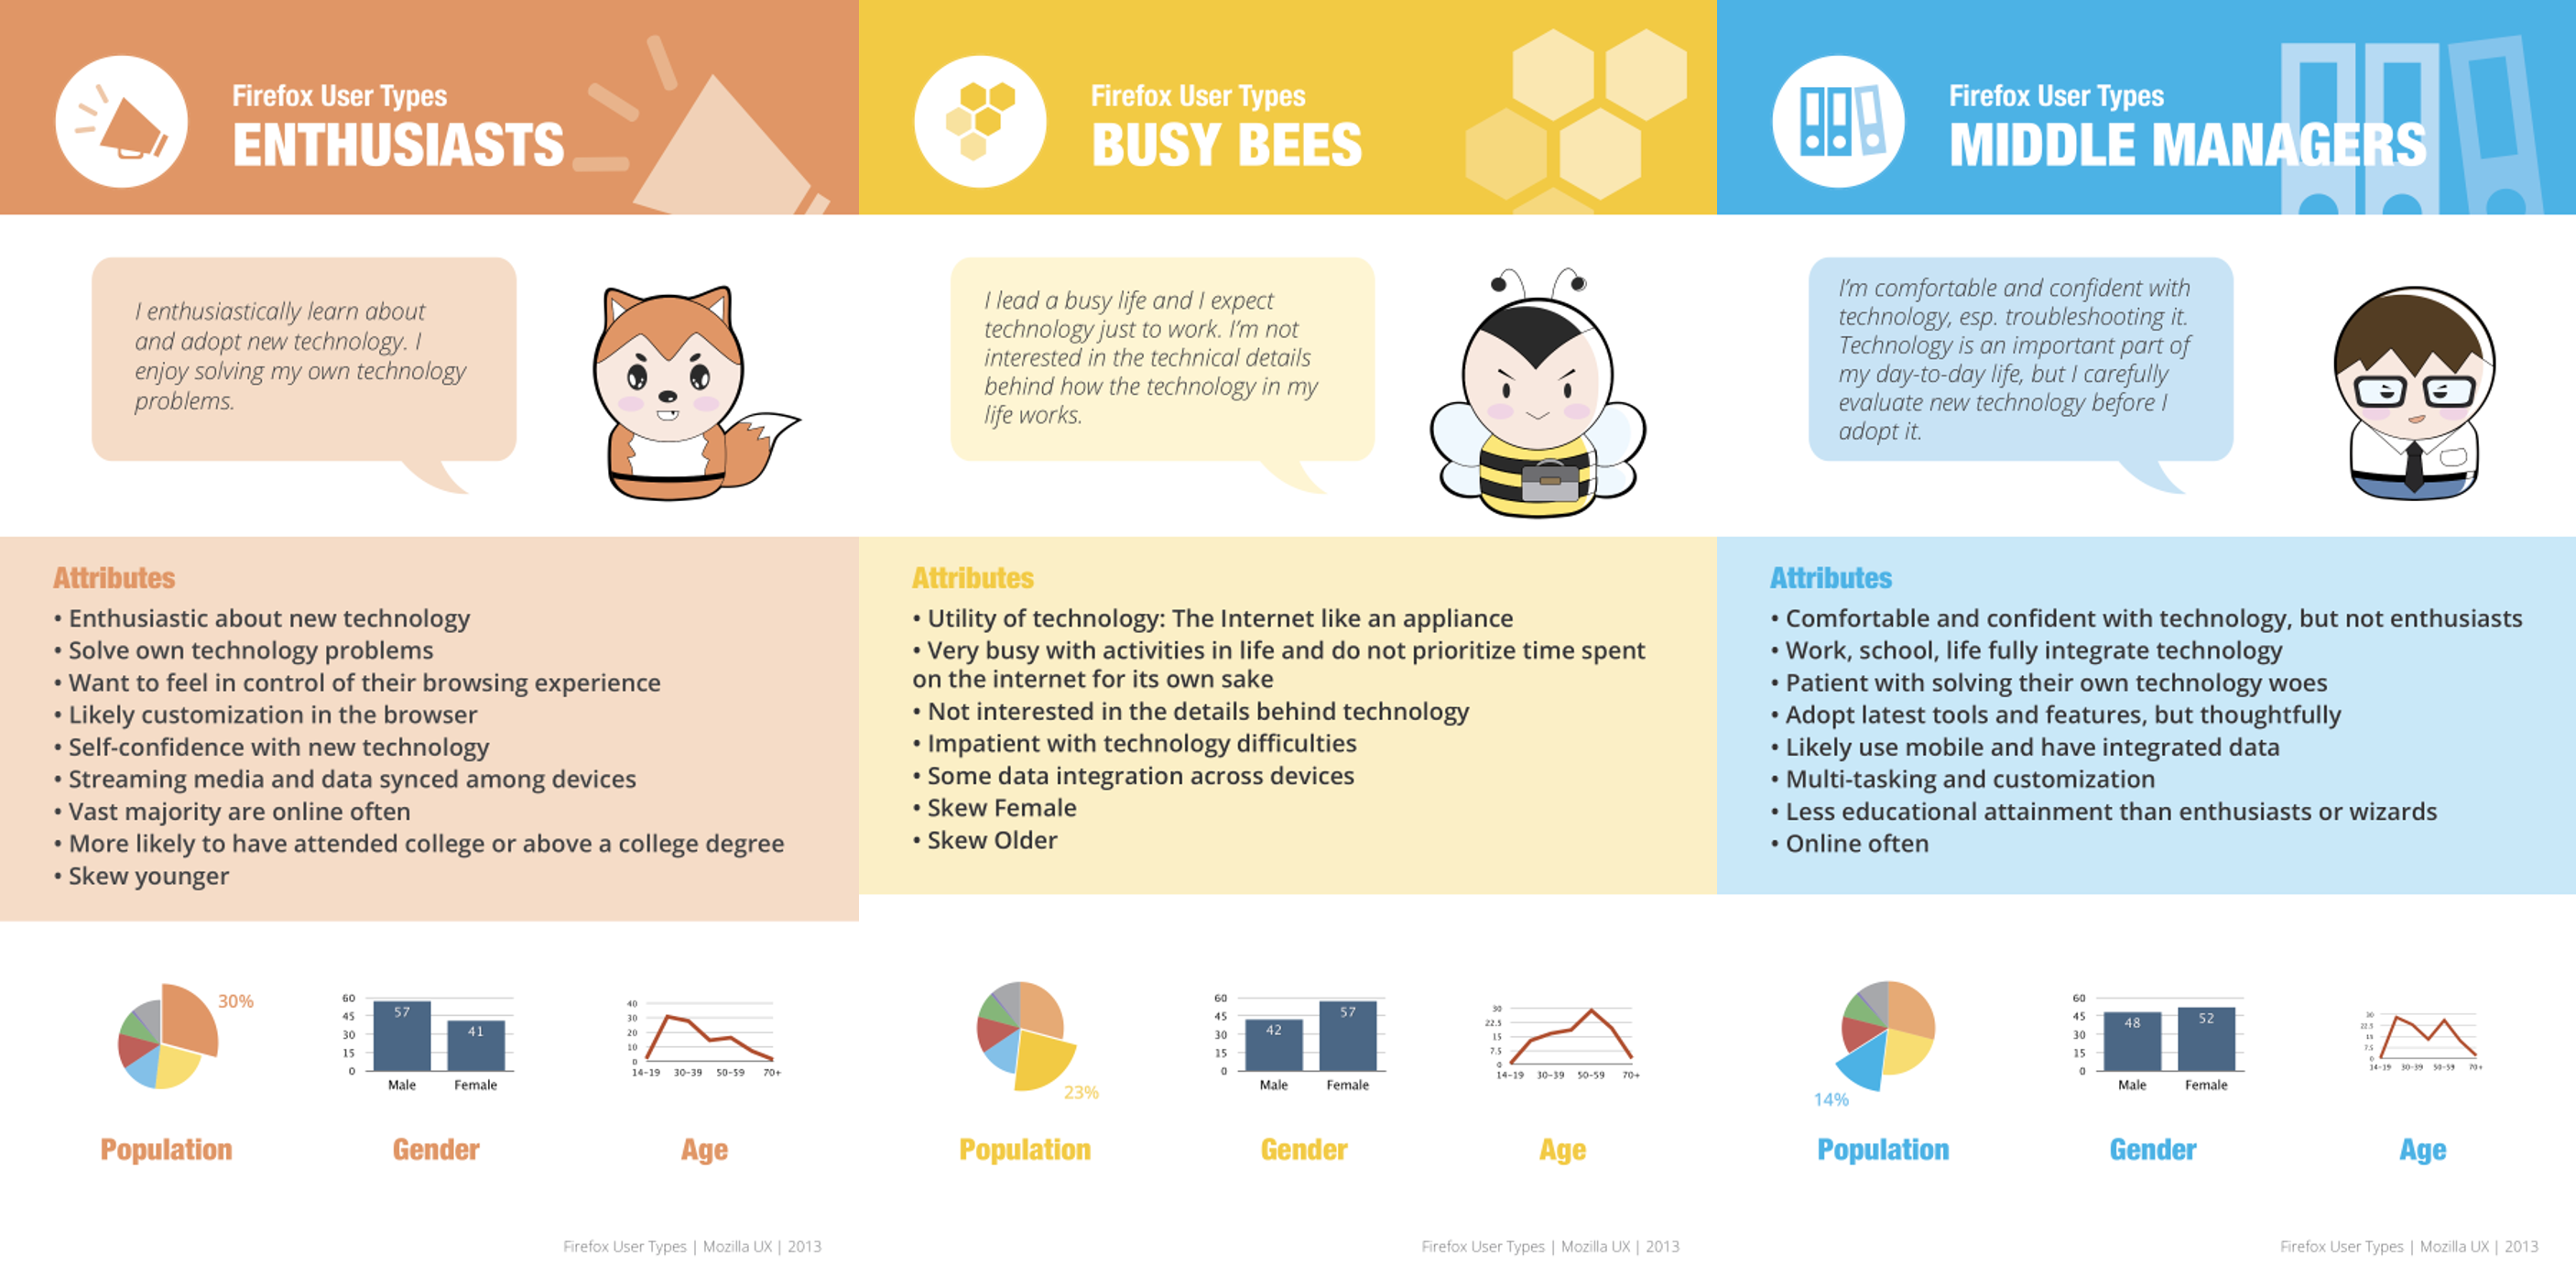
Firefox User Types
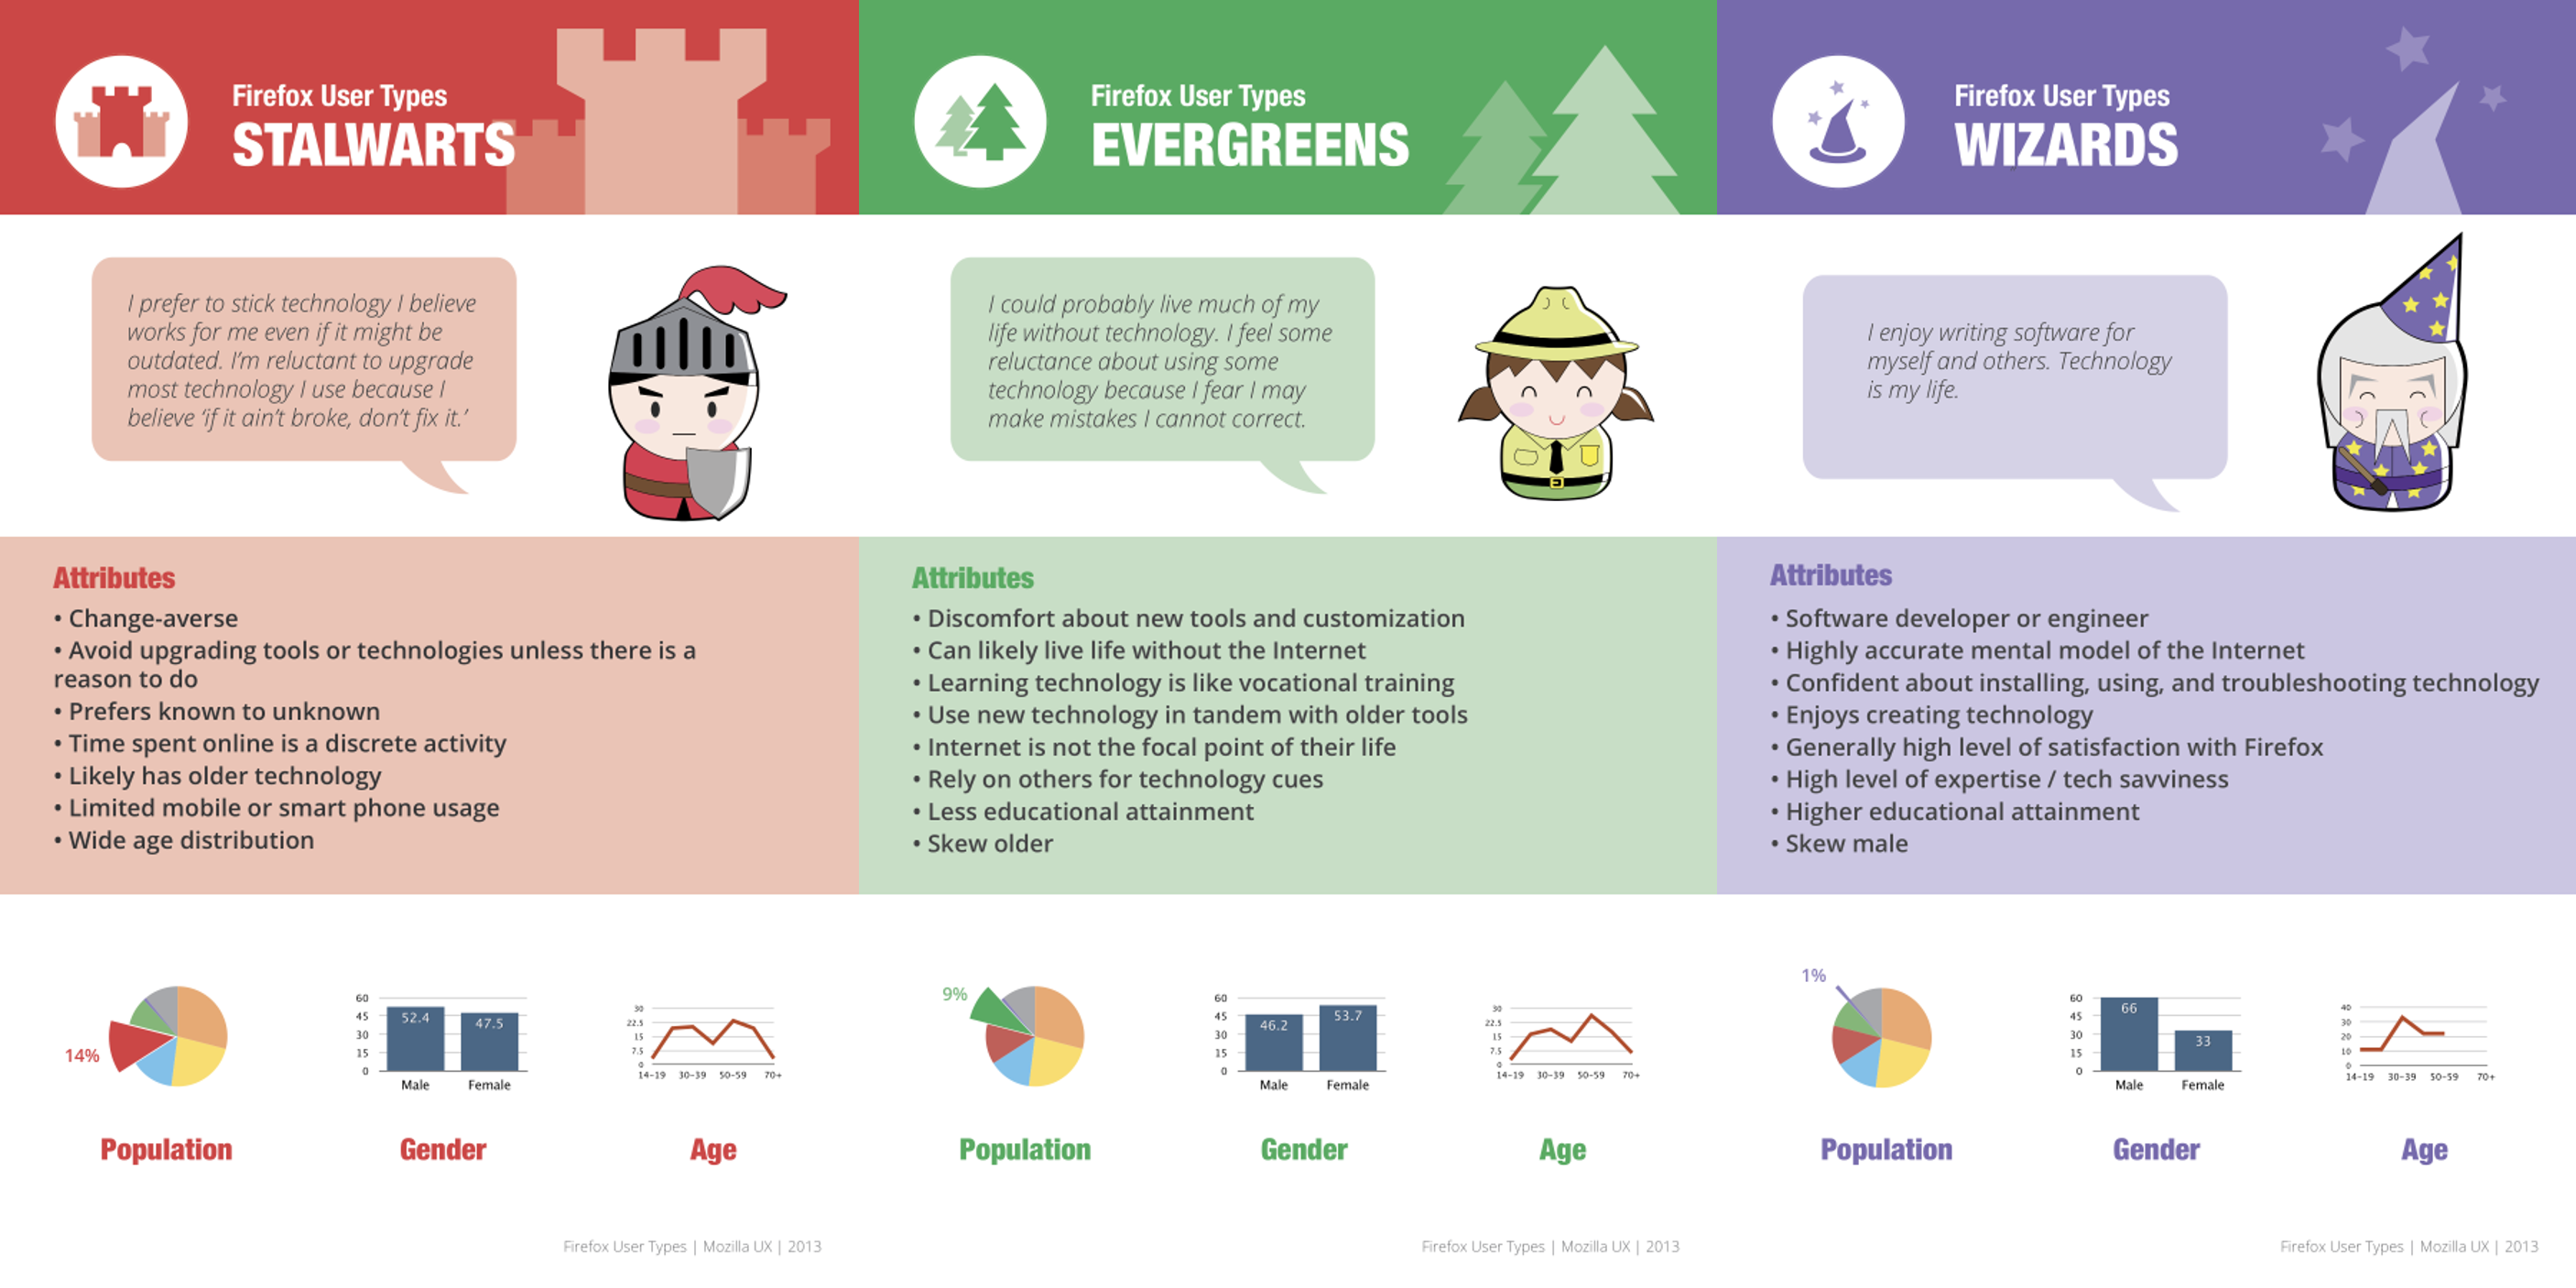
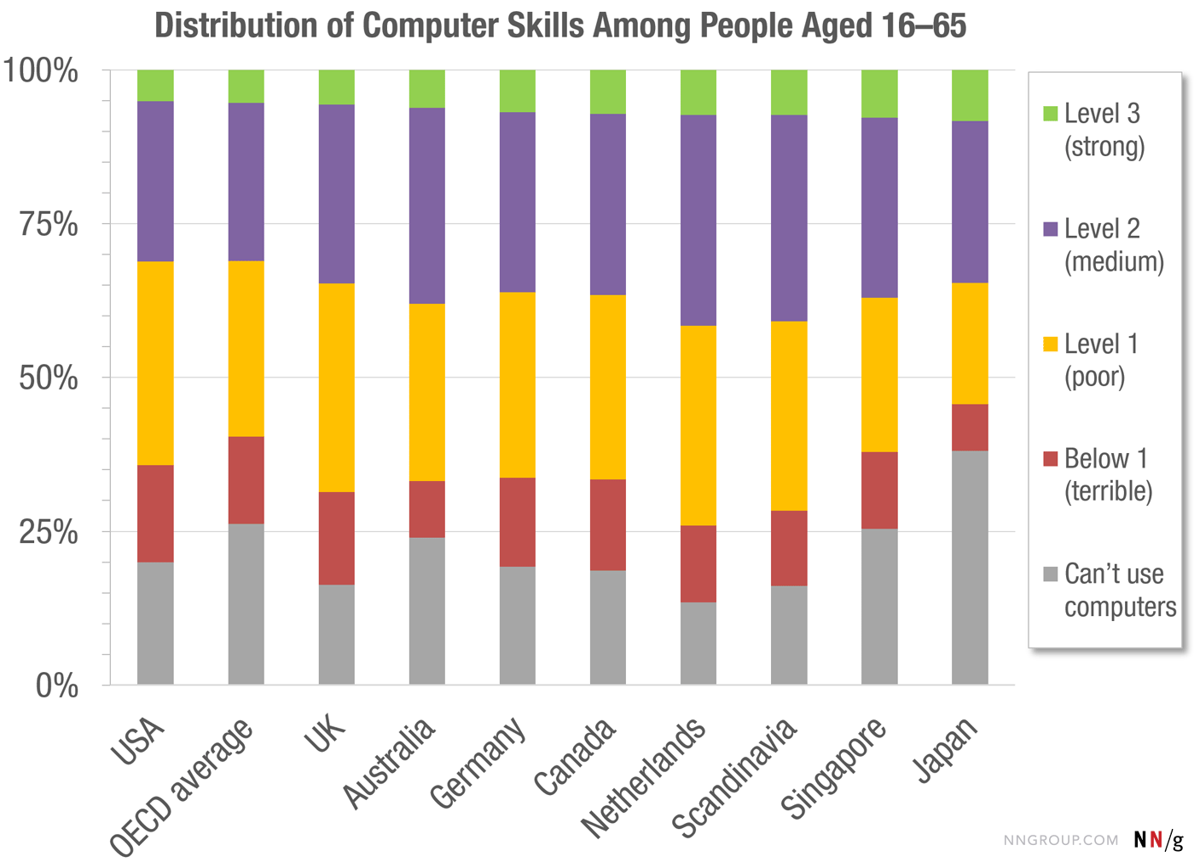
Firms don’t publicize segments
- UO website: “We stock our stores with what we love, calling on our — and our customer’s — interest in contemporary art, music and fashion. …
- “We offer a lifestyle-specific shopping experience for the educated, urban-minded individual in the 18 to 30 year-old range…’’

Firms don’t publicize segments
- Earnings call: “Our customer is from traditional homes and advantage, but this offers them the benefit of rebellion…
- Our customer is exposed to new ideas and philosophies. This can be a real involvement and work, or it could be just talk.
- Irreverence and concern can live together. Often products sell well that represent the concerns they have but also can speak to their irreverence.
- Our customer leads a pretty cloistered existence although they deem themselves worldly…they believe that they’re right and they believe that everything that’s happening to them is what’s happening everywhere.
- Our customer is highly involved in mating and dating behavior…one of the primary drives for their spending behavior…they work hard to postpone adulthood… ’’

Firms don’t publicize segments
- A. website: “a lifestyle brand that catered to creative, educated and affluent 30-45 year-old women…
- “Our customer is a creative-minded woman, who wants to look like herself, not the masses. She has a sense of adventure about what she wears, and although fashion is important to her, she is too busy enjoying life to be governed by the latest trends.’’

Firms don’t publicize segments
- Earnings call: “We don’t think of her in terms of age or affluence or even location. We try to think of her in her life stage and her sensibilities.
- “She’s recently wed. She’s settling down. She’s very interested less in the mating rituals and actually has been trying and building and creating an environment she wants to live in for herself and family.
- “She loves art and culture… And clothing and her living environment to her are canvases in which she’s able to express and control her life, whereas workplace and those things around her, she may not control.
- “We believe in many ways that’s what’s touched her and connect her to Anthropologie and why she is more loyal to us than to most retailers.’’

The Nuts and the Bolts
- Customer Data Platform (CDP)
- Data Marketplaces
Customer Data Platform (CDP) - 4 jobs
Data collection
  Intake data from numerous disparate sources:
  In-house, direct partners, data brokers, public data
Data unification or harmonization
Authenticate and de-duplicate rows and columnsData comprehension
  Generate inferences, test hypotheses, make predictions, estimate models
  Covers descriptive, diagnostic & predictive analytics
Data activation
Prescriptive analytics: Use data to inform and automate marketing actions
Data Marketplaces
Relatively new phenomenon:
Automated platforms for transacting & transmitting dataE.g., Snowflake Marketplace
Upsides
  More data types and sources
  Easy subscriptions, automatic updates
  Competitive marketplace may lower prices
  Less data wrangling
Some caveats
  Low barriers to entry
  Most datasets are not audited or externally validated (for now)
  Many buyers don't really know how to check data quality
  These conditions can lead to a lemons/peaches market
  Buyer beware: Always try before you buy
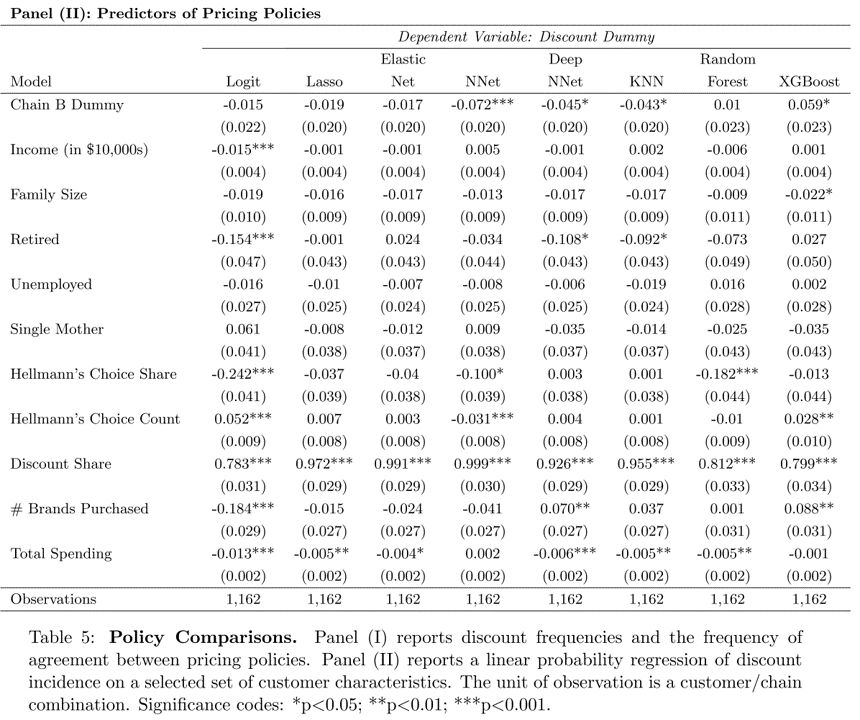
Recent evidence
- Comparing measurability: Demographics vs. Behavior
- Comparing performance of 8 demand models
Research question
Suppose we
Train demand model \(M\) to predict mayonnaise sales …
… using information set \(X\) …
… & choose targeted discounts for each consumer to maximize firm profits
- Essentially 3rd-degree price discrimination
Separately, using different data, we nonparametrically estimate how each individual responds to price discounts
      - This gives us ground-truth to assess each household's response to price discount
      - But, the nonparametric estimate can't give counterfactual predictions; we need M for that
How do targeted coupon profits depend on \(M\) and \(X\)?
      - We use model $M$ and $X$ to predict profits of offering a price discount to each individual household
      - We use ground-truth to calculate household response, then calculate profits across all households
      - We'll also compare to no-discount and always-discount strategies
A little bit of theory
For any price discount < contribution margin, giving a coupon to…
… our own brand-loyal customer directly reduces profit
… a marginal customer may increase profit
… another brand’s loyal customer does not change profit
So the demand model’s challenge is to correctly identify the marginal customers without accidentally identifying our own brand-loyal customer
- This research disregards the `post-promotion dip' for simplicity
Information sets \(X\)
Base Demographics:
Income, HHsize, Retired, Unemployed, SingleMomExtra Demographics: Age, HighSchool, College, WhiteCollar, #Kids, Married, #Dogs, #Cats, Renter, #TVs
Purchase History: BrandPurchaseShares, BrandPurchaseCounts, DiscountShare, FeatureShare, DisplayShare, #BrandsPurchased, TotalSpending
Demand Models \(M\)
Bayesian Logit models (3)
     - Based on utility maximization in which consumers compare utility and price of each available product
     - Includes Hierarchical and Pooled versions
Multinomial Logistic Regressions (2)
- Estimated via Lasso and Elastic NetNeural Network (2)
- Including single-layer and deep NNKNN (Nearest-Neighbor Algorithm) (1)
Random Forests (2)
- Including standard RF for bagging and XGBoost for boosting
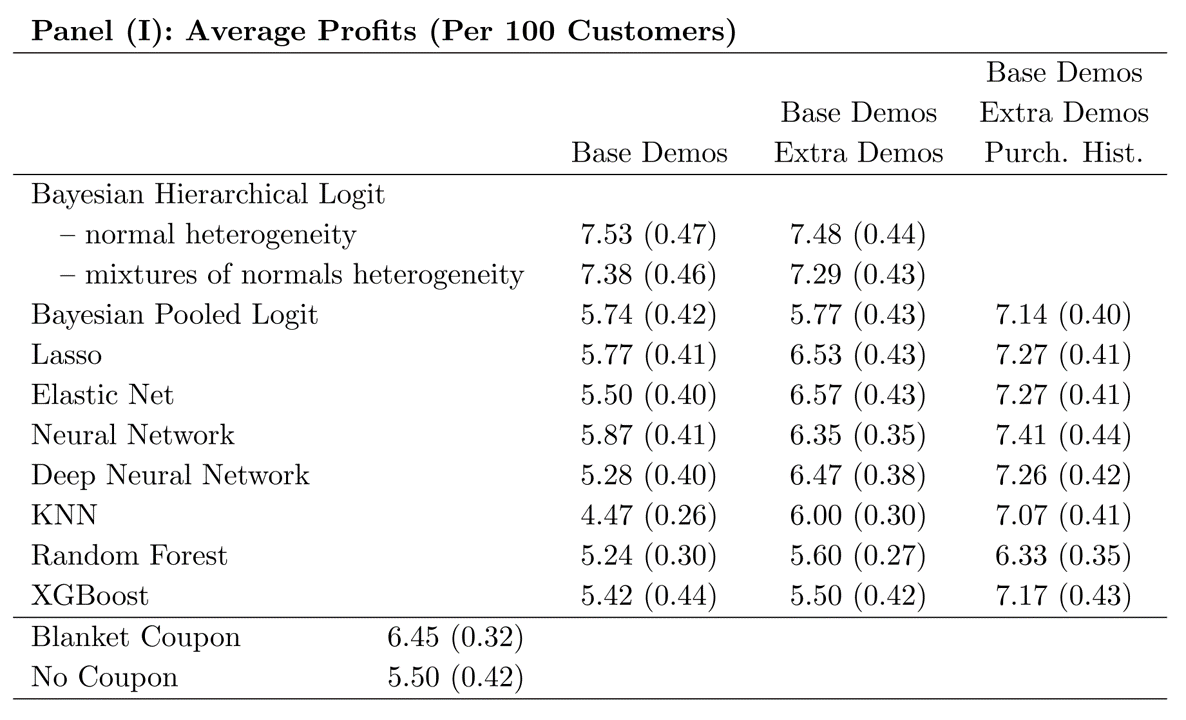
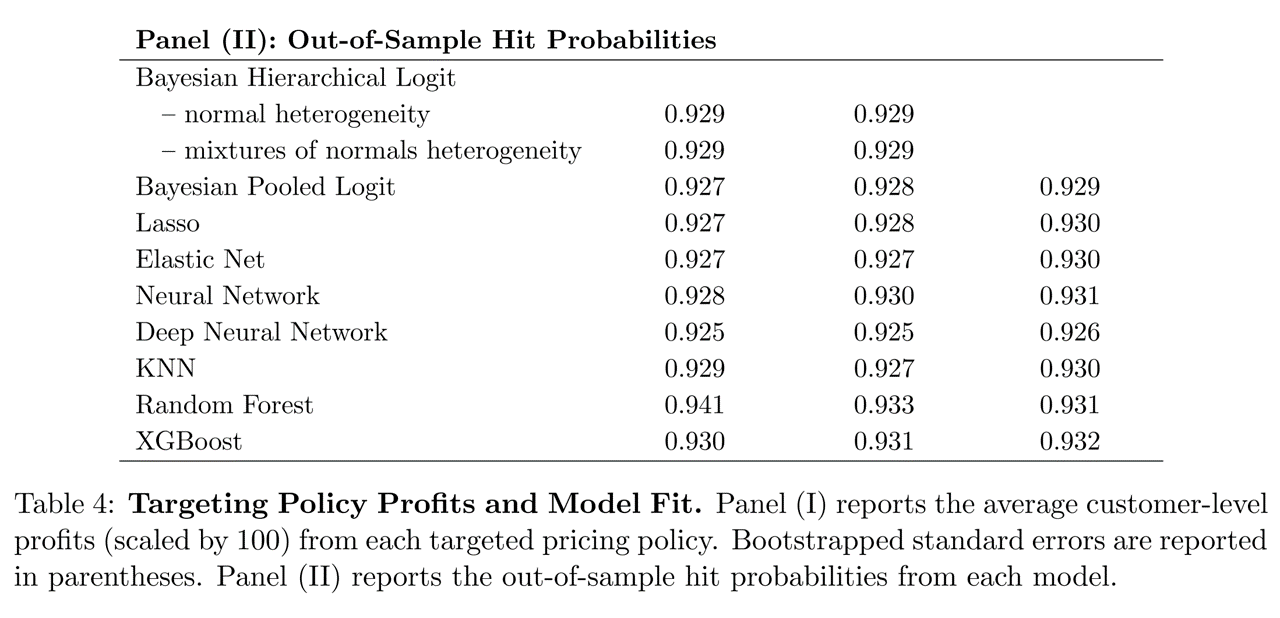
Takeaways
To predict behavior, use past behavior
Economic theory can help demand models to perform well with limited behavioral data
ML performance depends critically on data quality. Predictions do not always outperform economic models
Statistical performance \(\ne\) economic performance
We’ll start estimating logit models soon

- Meet your study group. Create a group chat. Arrange a regular weekly time to discuss homework, preferably in person. Enter your schedule into Canvas Intermission 2.
How we segment
- Data
- Methods
- Suppose we segment the smartphone market according to each customer’s desired brand.
- Is this a good approach?
How to pick attributes?
- We want to segment based on attributes that drive sales, profit, retention. But how?
- Theory
- Market research
- Customer database
- Consult customer experts (salespeople)
- Find out what other firms are doing
- Let sales data pick for us (het. logit)

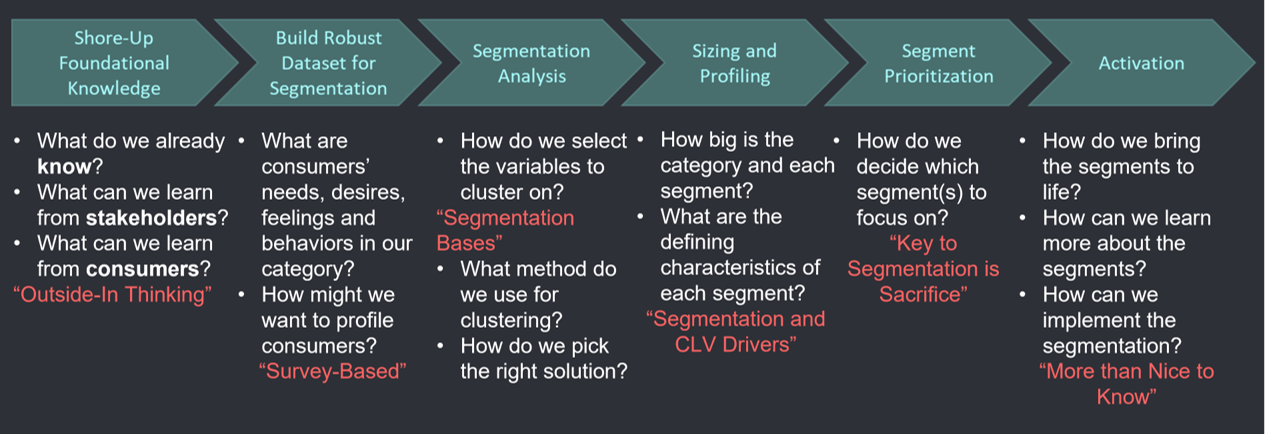
How GBK segments
Cluster analysis
- “Unsupervised learning” - techniques to segment/partition data
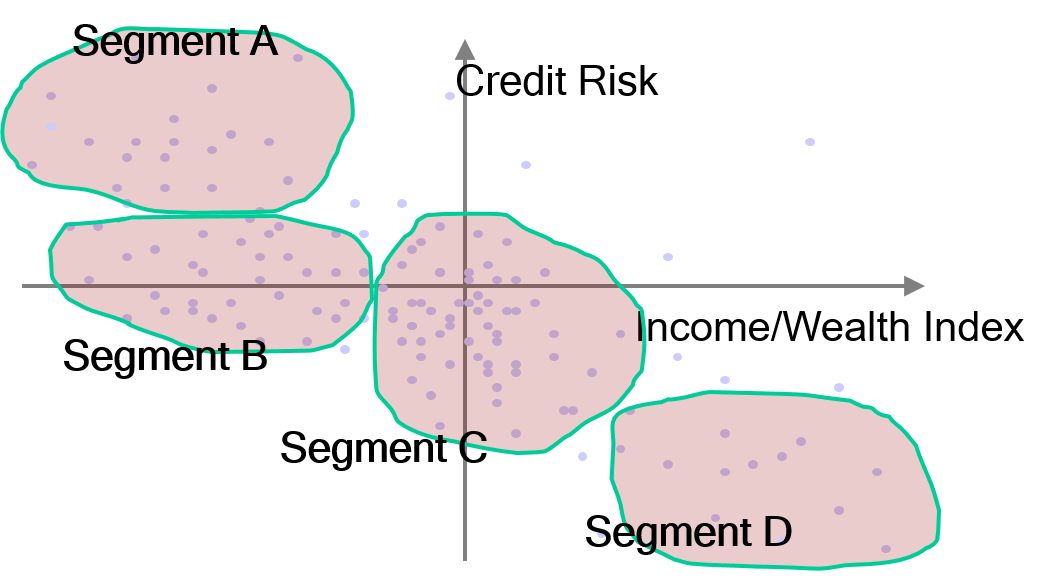
K-Means
- Simple, elegant approach to define \(k=1,\ldots,K\) segments
- Main idea: Choose \(K\) centroids \(\{C_1, ..., C_K\}\) to minimize total within-segment variation:
\[ \min \sum_{k=1}^K W(C_k)\]
- where \(W(C_k)\) measures variation among customers assigned to segment \(k\)
K-Means
- Most common \(W(C_k)\) function is Euclidean distance
- Given a set of \(i \in I_k\) customers in segment \(k\), each with \(p=1,...,P\) measured attributes \(x_{ip}\),
\[ W(C_k)=\sqrt {\sum_{i \in I_k} \sum_{p} (x_{ip}-\bar{x}_{kp})^2}\]
where \(\bar{x}_{kp}\) is the average of \(\bar{x}_{ip}\) for all \(i \in I_k\), and the centroid is \(C_k=(\bar{x}_{k1}, ..., \bar{x}_{kP})\)
K-Means Algorithm
- How do we assign customers to segments?
- There are nearly \(K^n\) ways to partition \(n\) obs into \(K\) clusters
- Happily, a simple algorithm finds a local optimum:
- Randomly choose \(K\) centroids
- Assign every customer to nearest centroid
- Compute new centroids based on customer assignments
- Iterate 2-3 until convergence
- (Optional) Repeat 1-4 for many random centroids
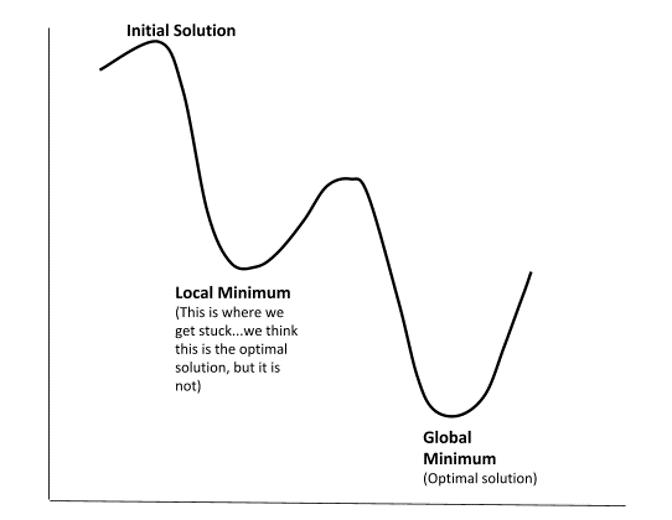
    - $W$ is not globally concave, so we can't guarantee a global minimum
    - Thus, we pick many starting points, and see which offers the lowest W
    - Note: Some algos promise to find global minimum, but this is usually impossible without stringent criteria. Can be a 'tell'
Script prelude: Data structures
- Matrix or Table:
2-dimensional data storage structure. Often inefficient - R data.frame: Compact, flexible way to store data
- Tibble: Tidy’s version of data.frame. Similar
- List: Set of disparate structures
Class script
- Standardizing variables
- Running canned kmeans
- Selecting from a list
- Iris example
- Coding & graphing kmeans
Wrapping up
Homework
- Let’s take a look

Recap
- Customer attributes are similar within segments and differ between segments
- Good segments are Measurable, Accessible, Substantial, Actionable
- Customer behavior usually predicts behavior better than demographics

Going further
- How the Pentagon Learned to Use Targeted Ads to Find Its Targets-and Vladimir Putin
- Firefox User Types in North America
- K-Means Clustering: An Explorable Explainer
- Optimal Price Targeting by SSA 2022
- Learning the k in k-means (Hammerly and Elkan 2003)
