Product Attributes
UCSD MGT 100 Week 03
Let’s reflect

Marketing strategy
Segmentation: How do customers differ
Targeting: Which segments do we seek to attract and serve
Positioning
    - What value proposition do we present
    - How do our product's objective attributes compare to competitors
    - Where do customers perceive us to be
    - How do we want to influence consumer perceptions
Market mapping helps with Positioning

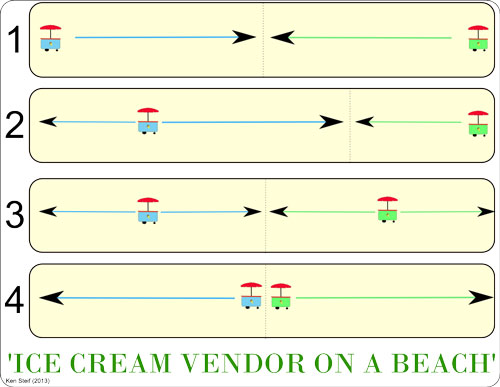
Hotelling (1929)
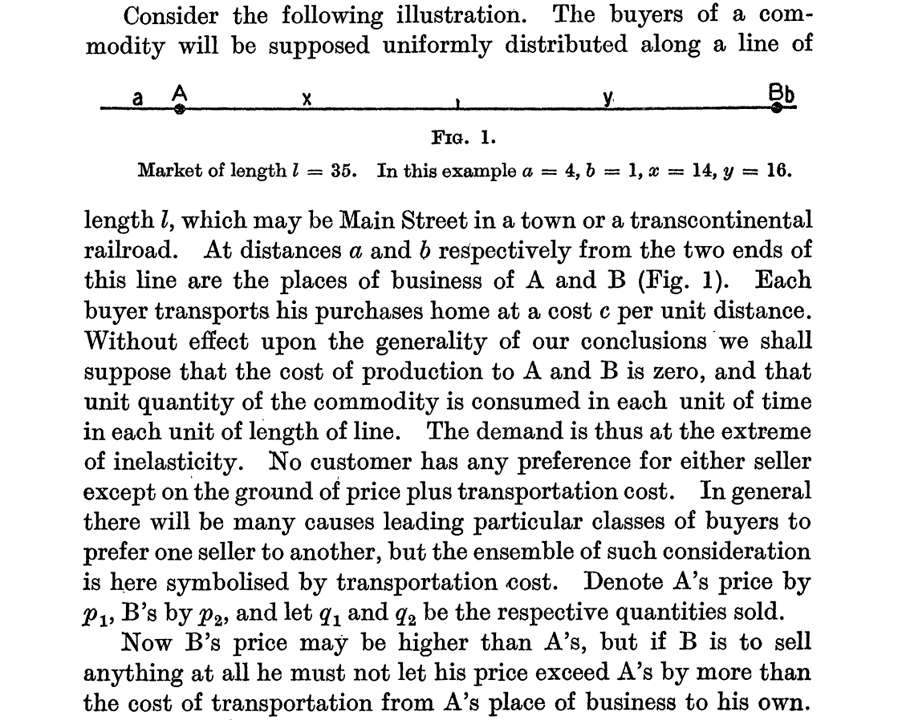
Ice cream vendors
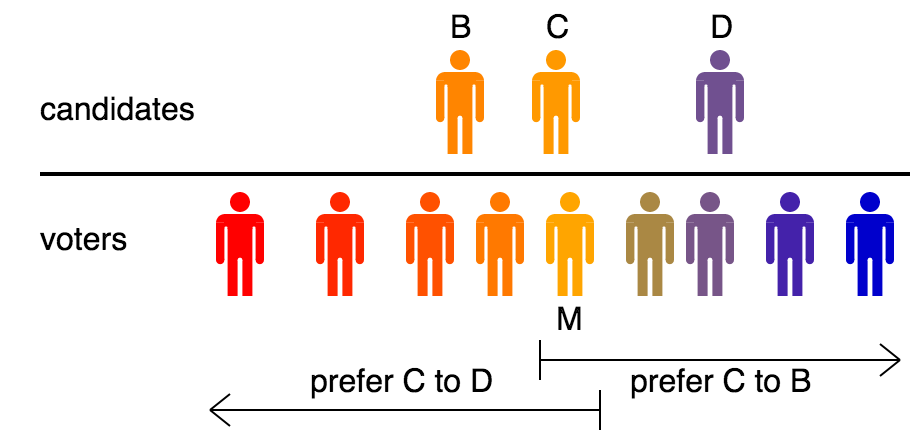
Median voter theorem
Conceptual organization
Mapping Practicalities
How to measure intangible attributes like trust?
   - Ask consumers, e.g. "How much do you trust this brand?"
   - Marketing Research exists to measure subjective attributes and perceptions
What if we don’t know, or can’t measure, the most important attributes?
- Multidimensional scalingHow should we weigh attributes?

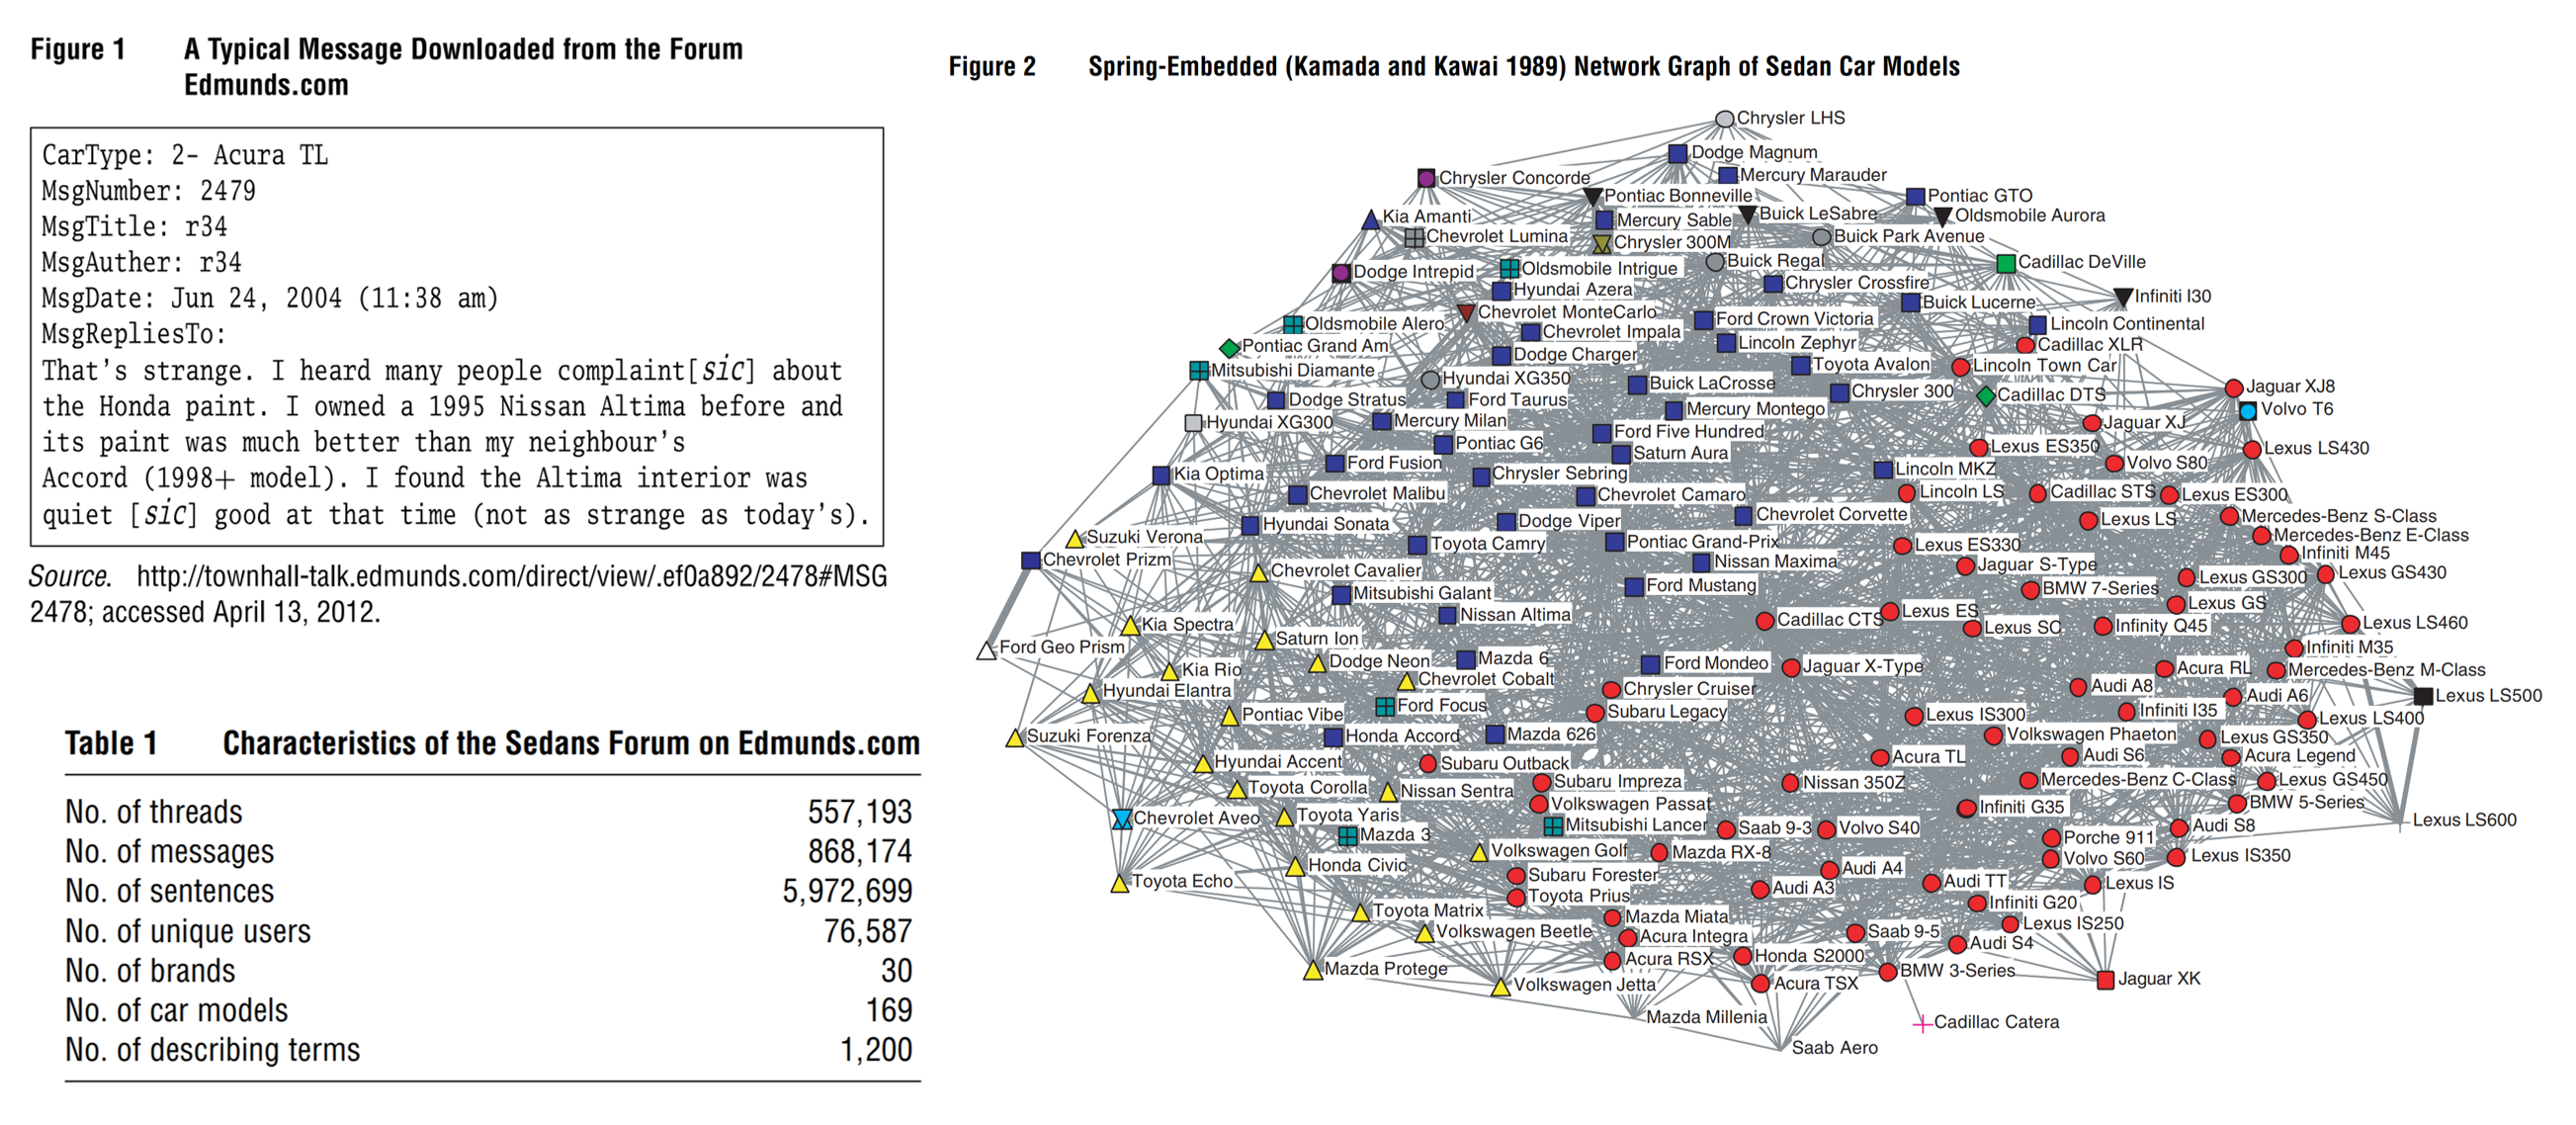
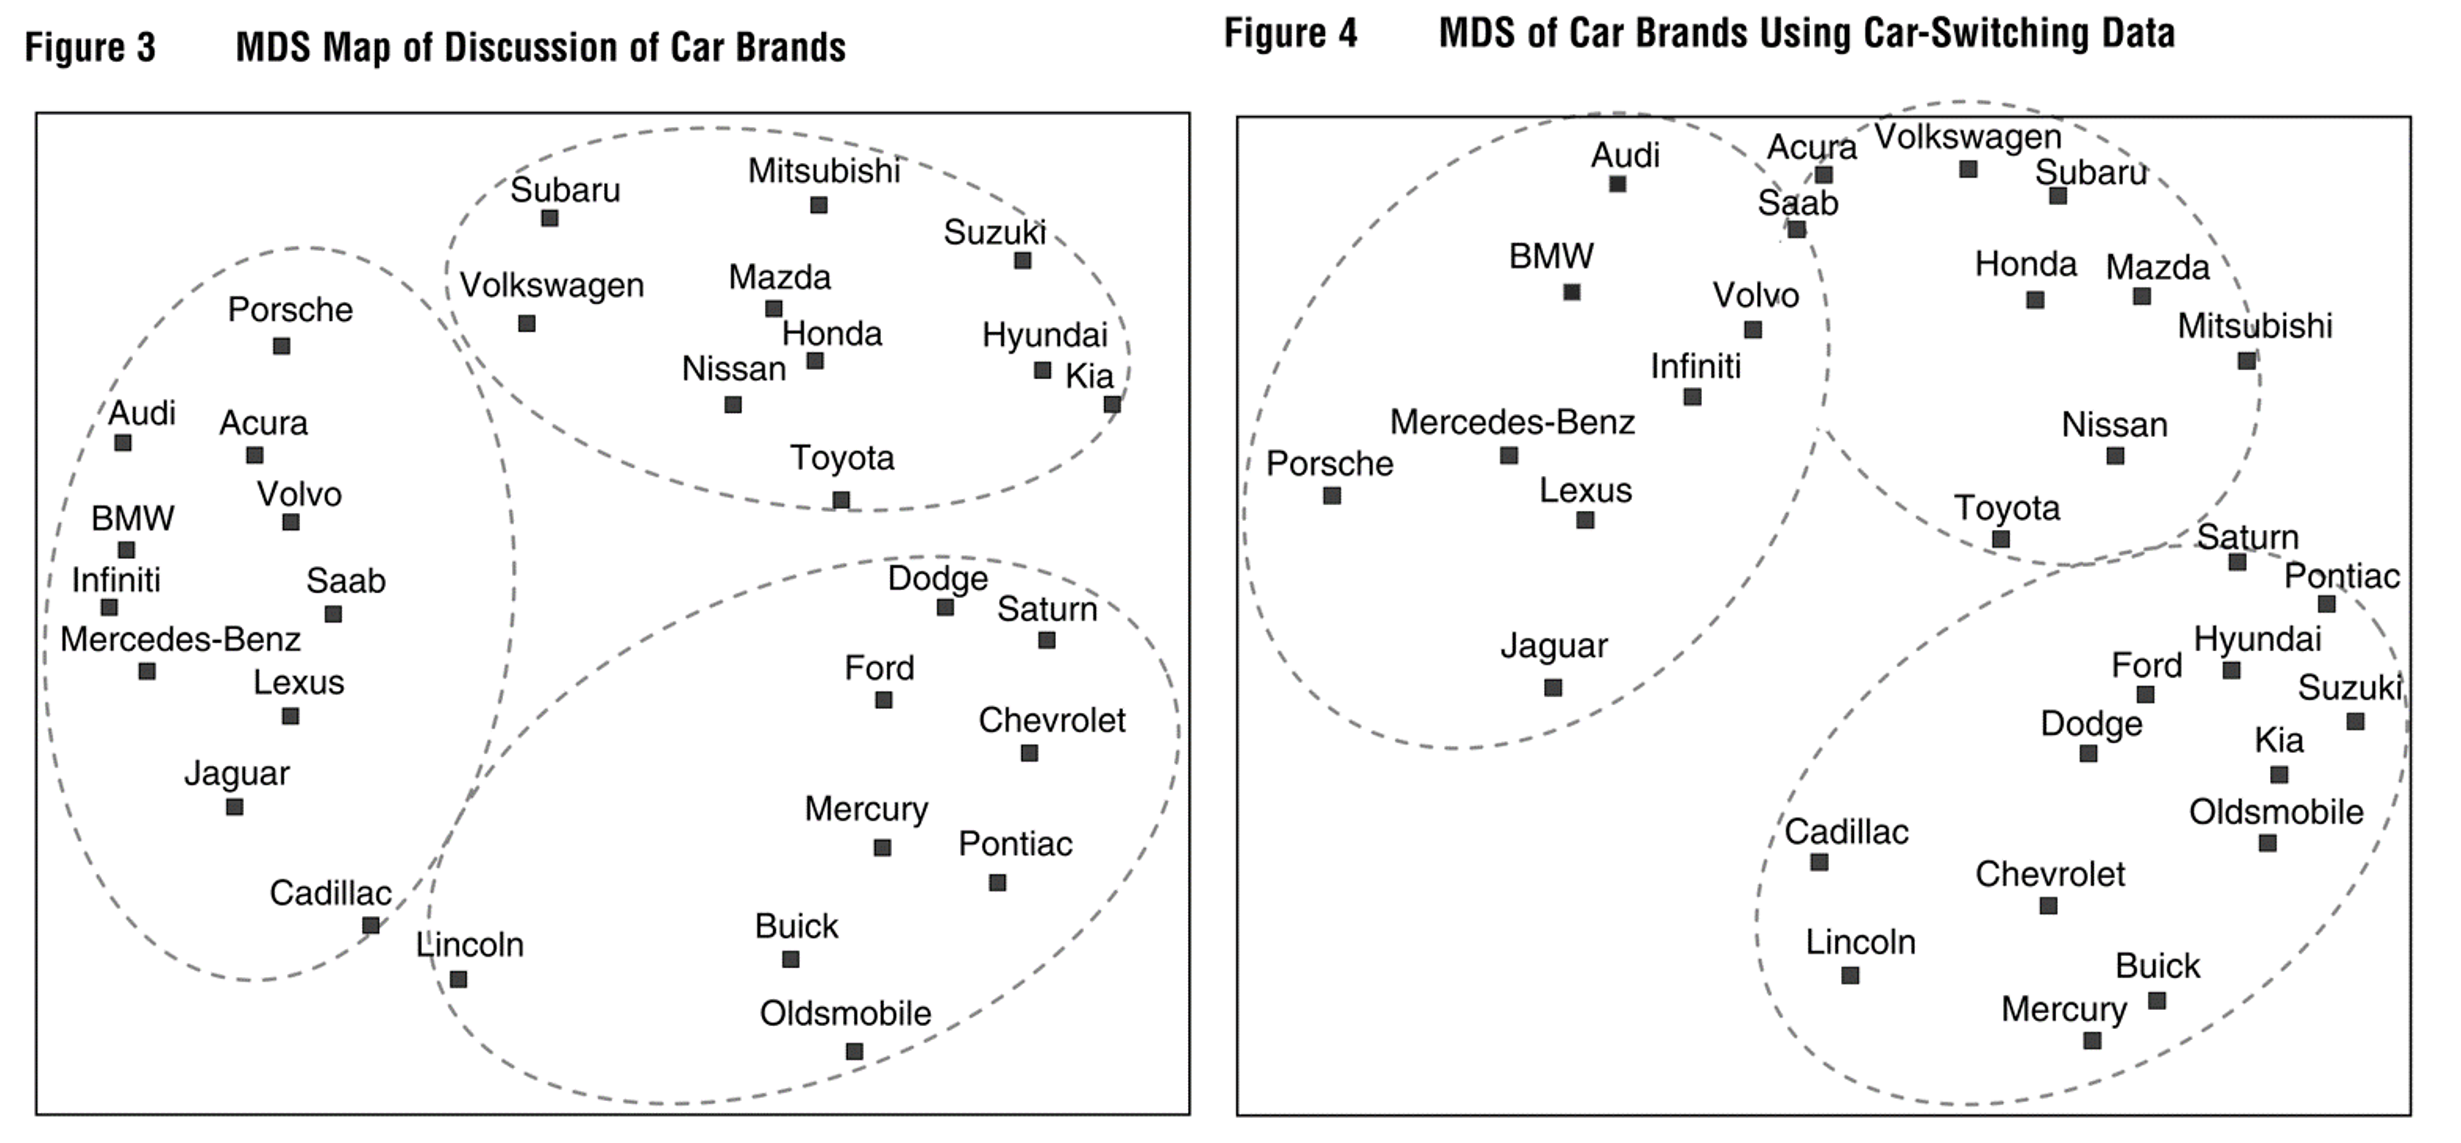
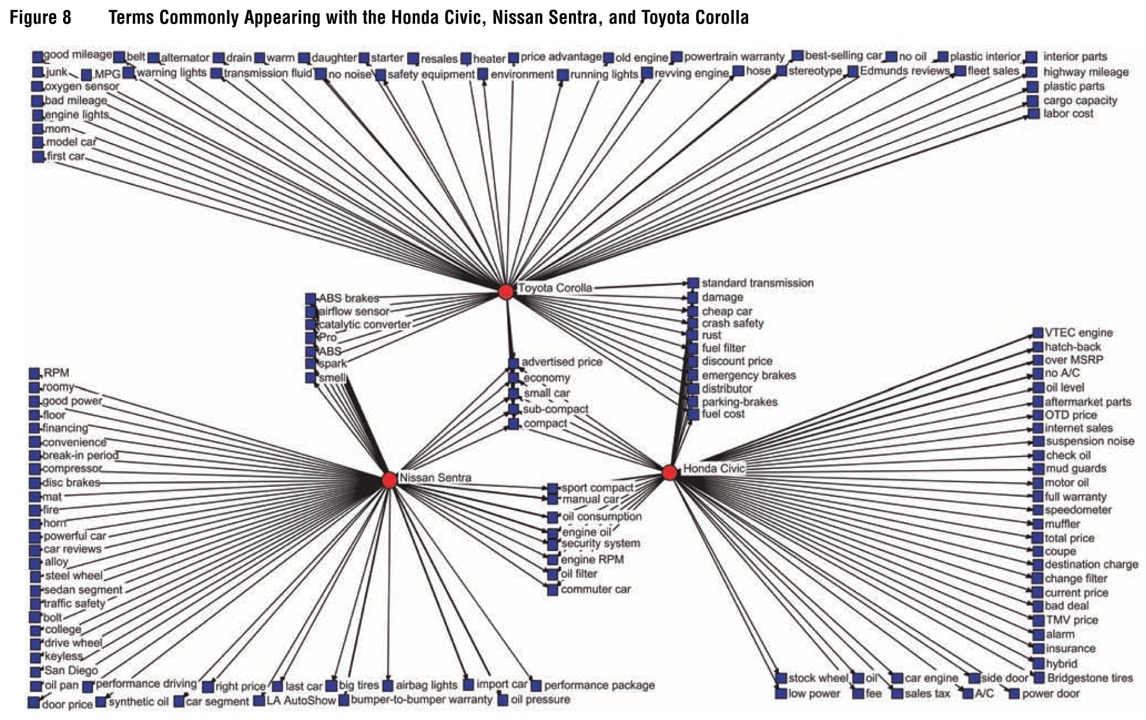
Example: Netzer et al. (2012)
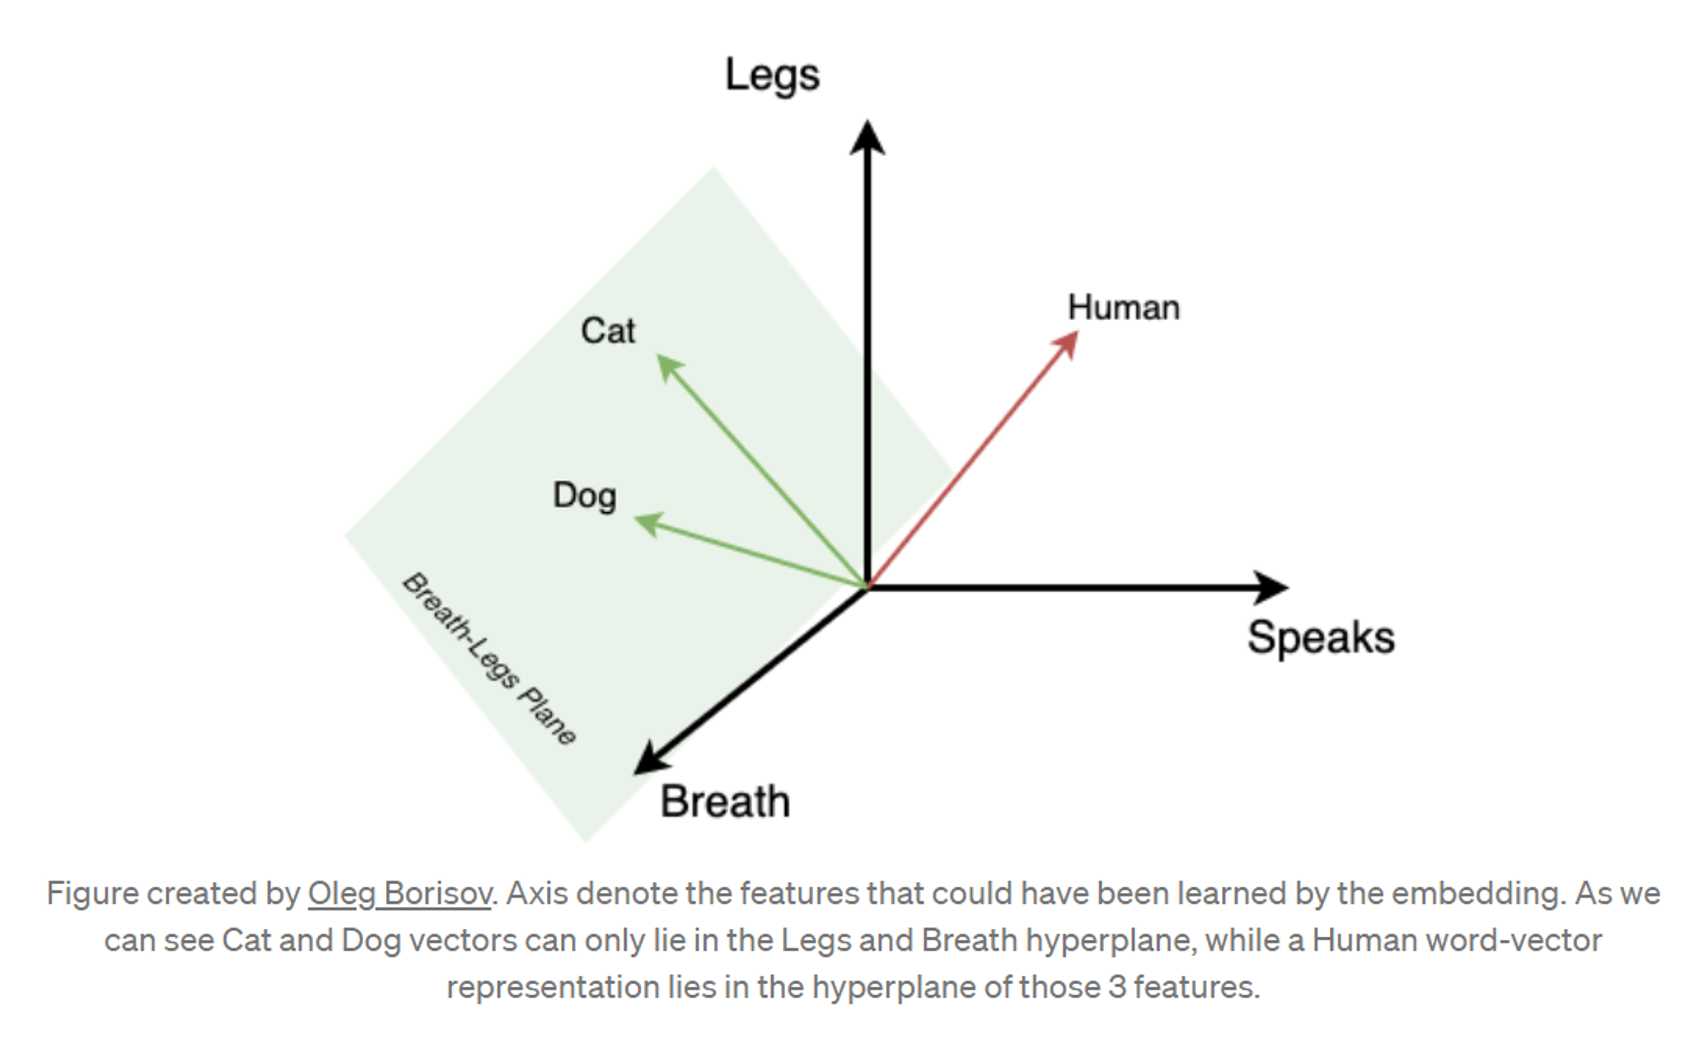
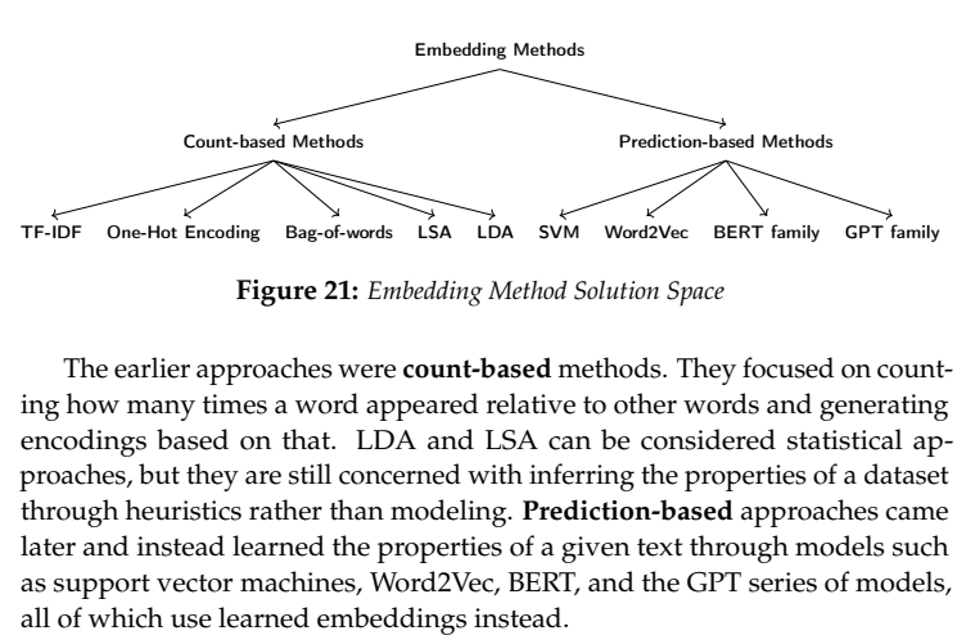
Embeddings
represent words as vectors in high-dim space
- Really, "tokens," but assume words==tokens for simplicityAssume \(W\) words, \(A<W\) abstract concepts
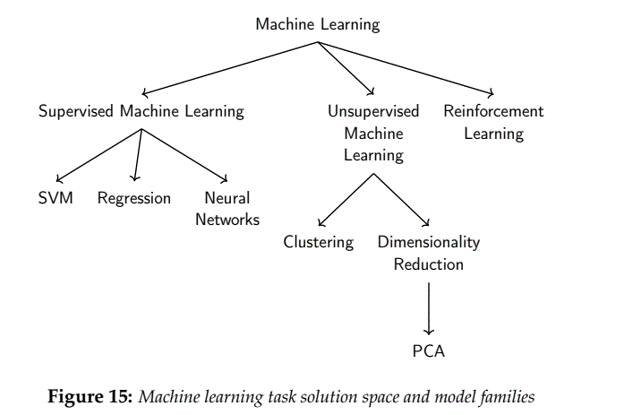
- Assume we have all text data from all history. Each sentence is a point in $W$-dimensional spaceWe could run PCA to reduce from \(W\) to \(A\) dimensions
    - Assume we have infinite computing resources
    - We now have every sentence represented as a point in continuous A-space
Cool things about embeddings
- Compression stores enormous textual data in a small space, other than human memory
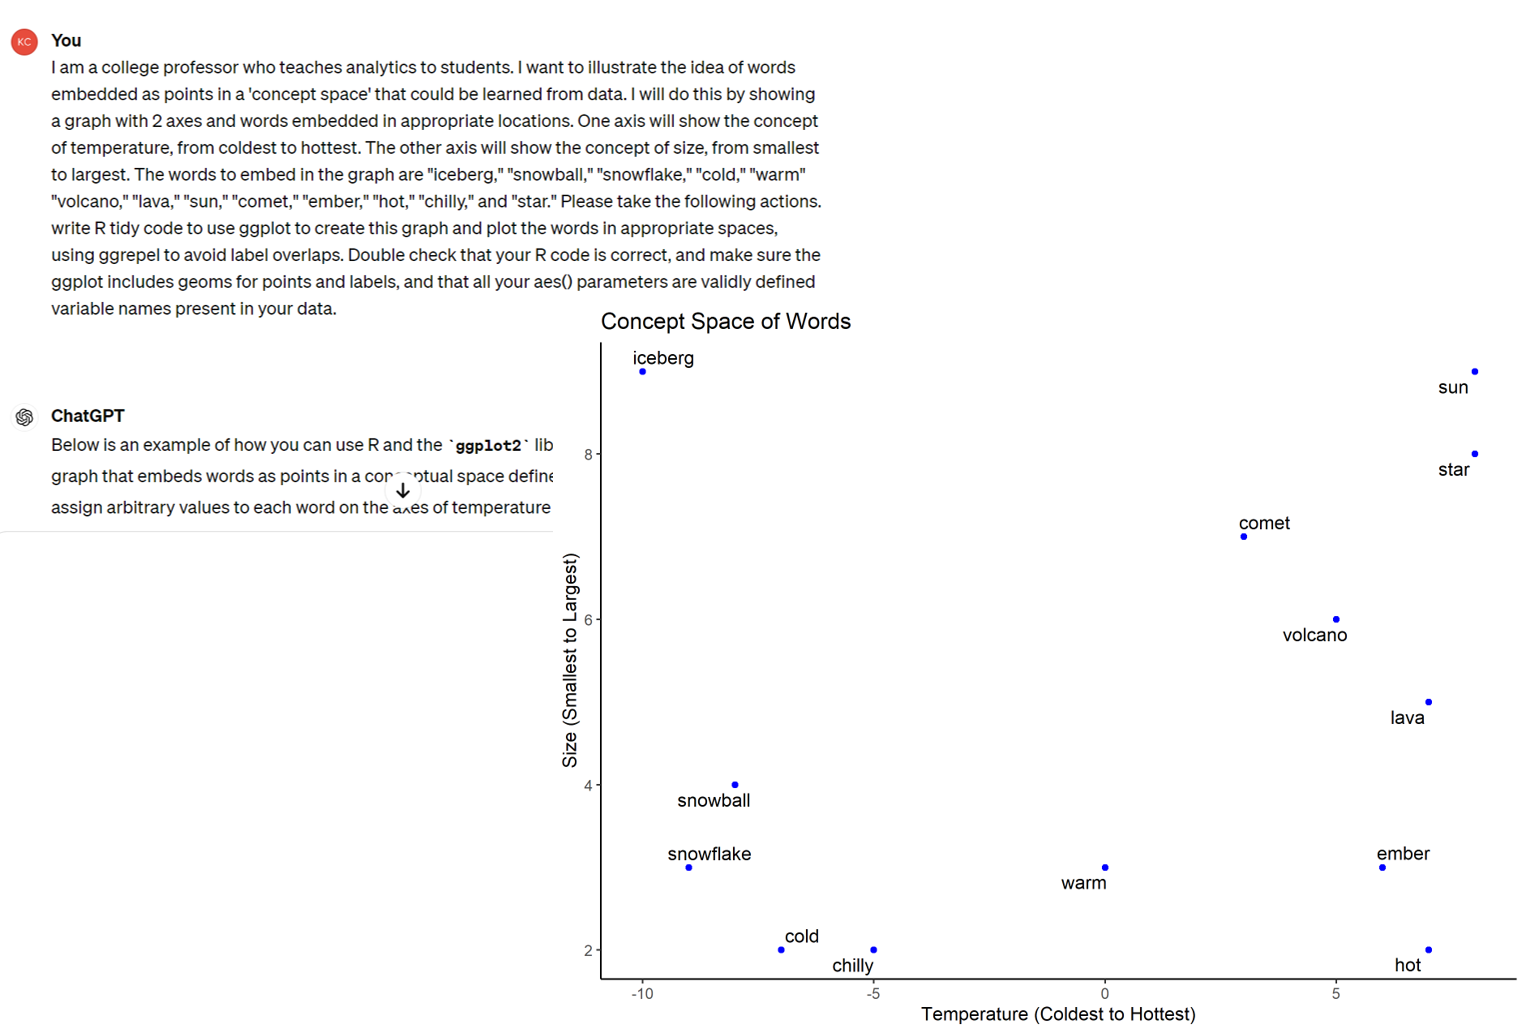
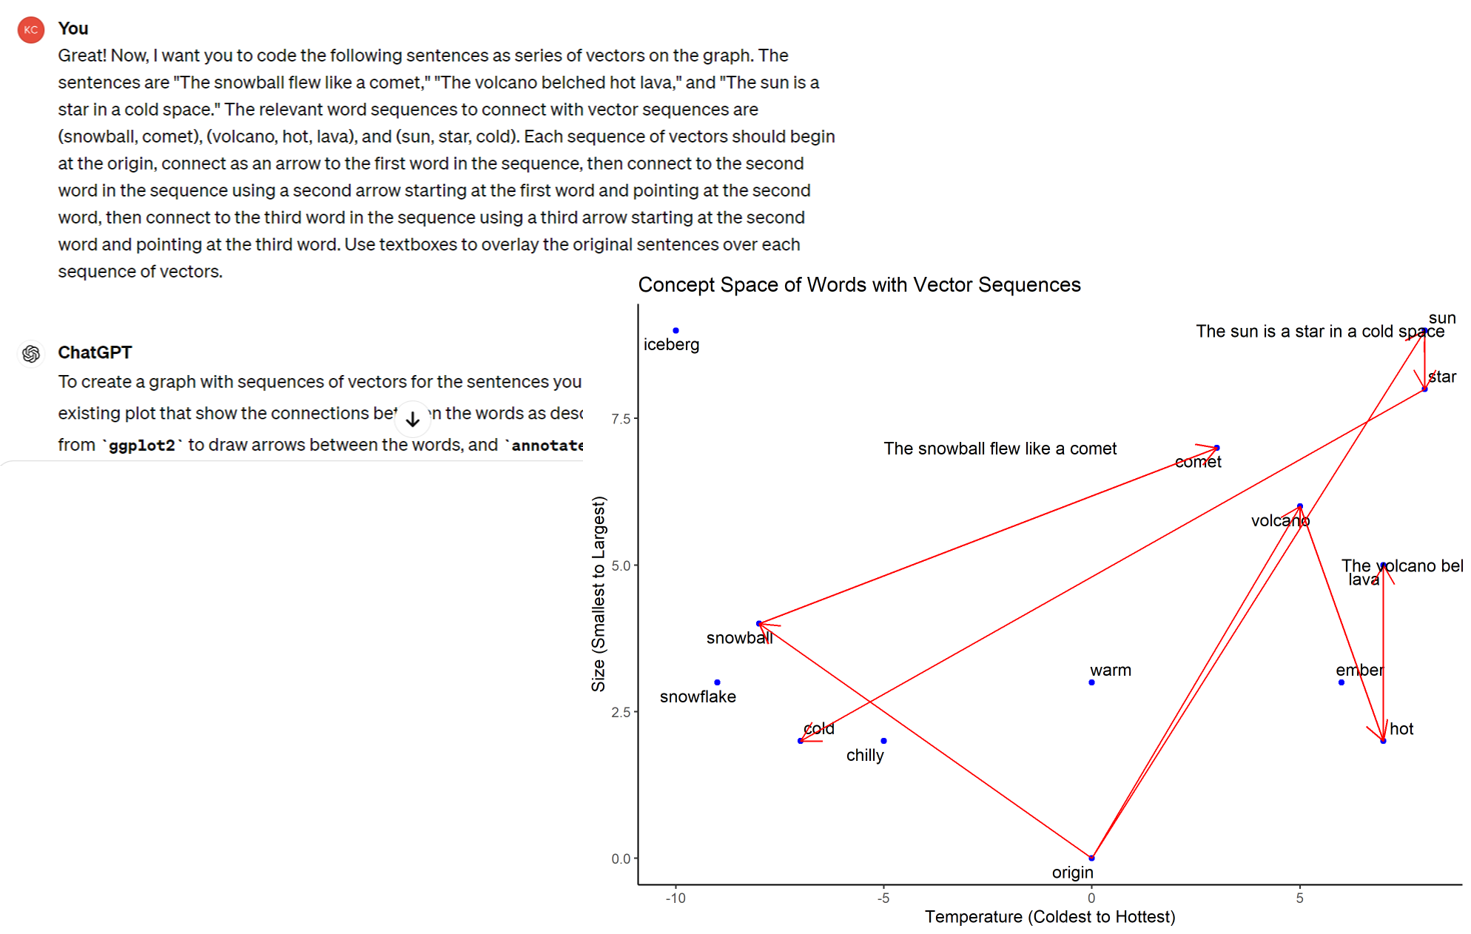
- We can do math using words!

Many ways to encode embeddings
Example: Concept Space
Example: Sentences as Vector Sequences

- How have you seen LLMs affect the world over the past year?
Trucks Example

Phones/Service Plans Example

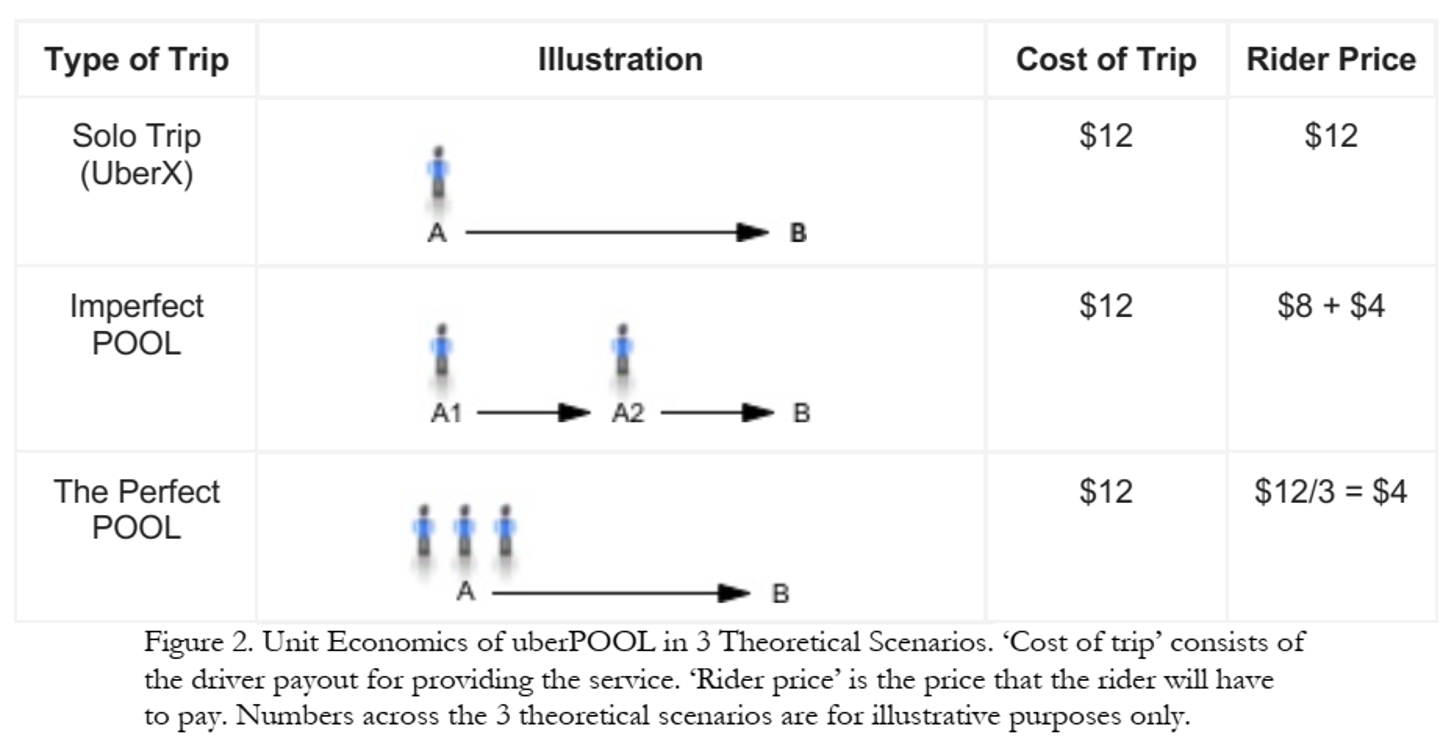
Case study: UberPOOL
In 2013, Uber hypothesized
- some riders would wait and walk for lower price
- some riders would trade pre-trip predictability for lower price
- shared ridership could ↓ average price and ↑ quantity
- more efficient use of drivers, cars, roads, fuel
Approach
23 in-home diverse interviews in Chicago and DC
   - Interviewed {prospective, new, exp.} riders to (1) map rider's regular travel, (2) explore decision factors and criteria, (3) a ride-along for context
   - Findings identified 6 attributes for testing
Online Maximum Differentiation Survey
- Selected participants based on city, Uber experience & product; N=3k, 22min
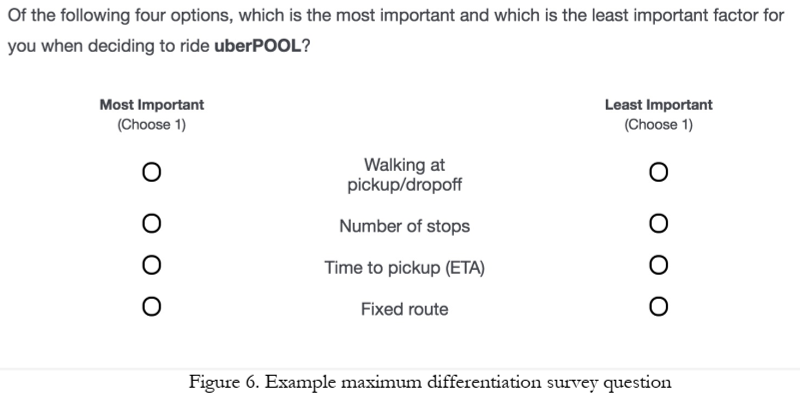
Maxdiff results

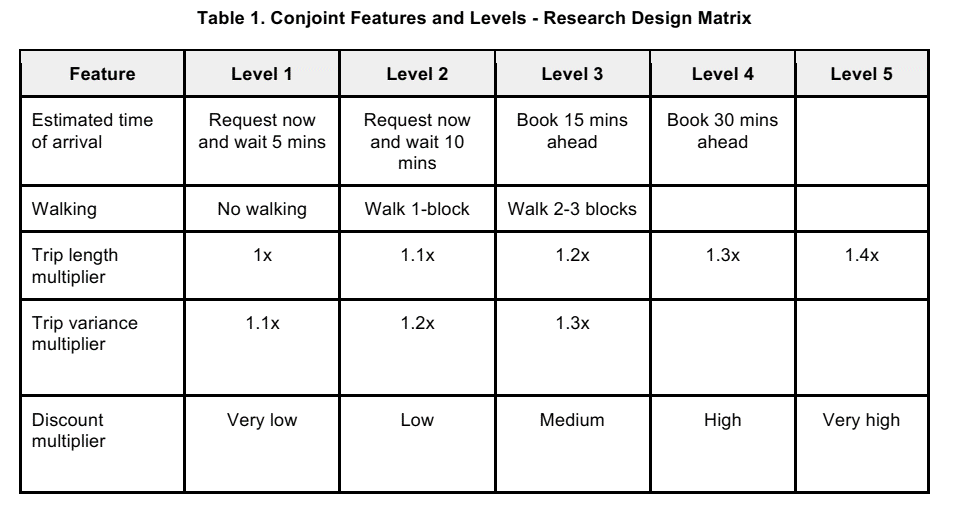
Conjoint Design
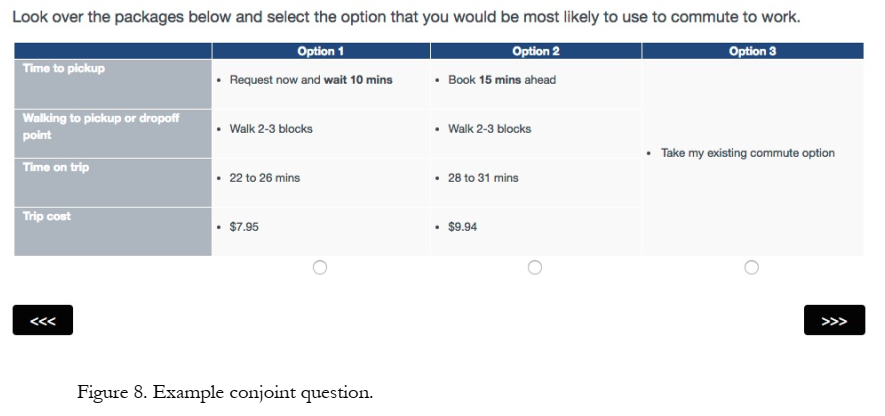
Conjoint Sample Question
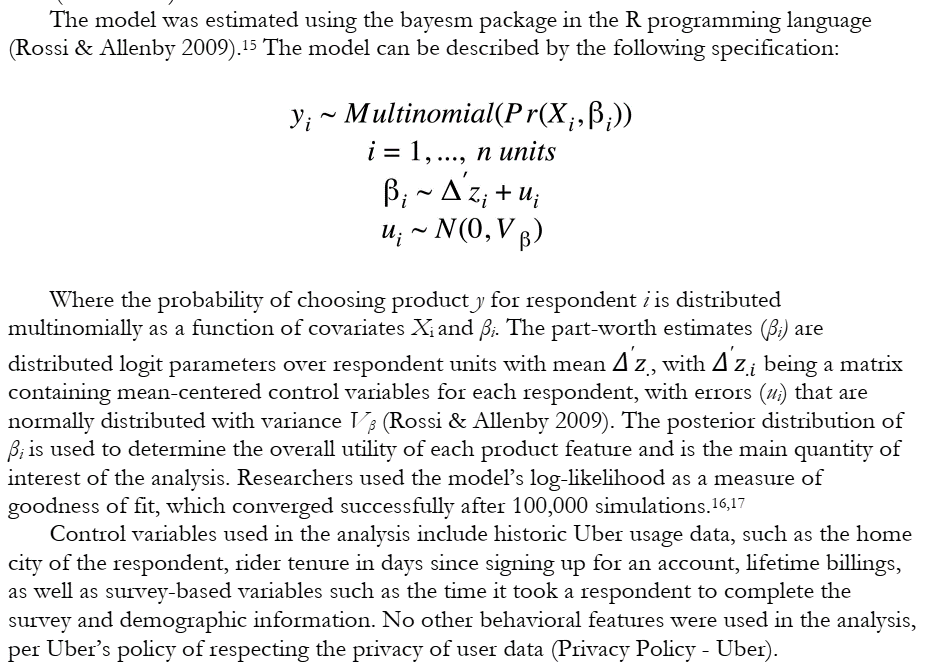
Conjoint Model
Conjoint Findings
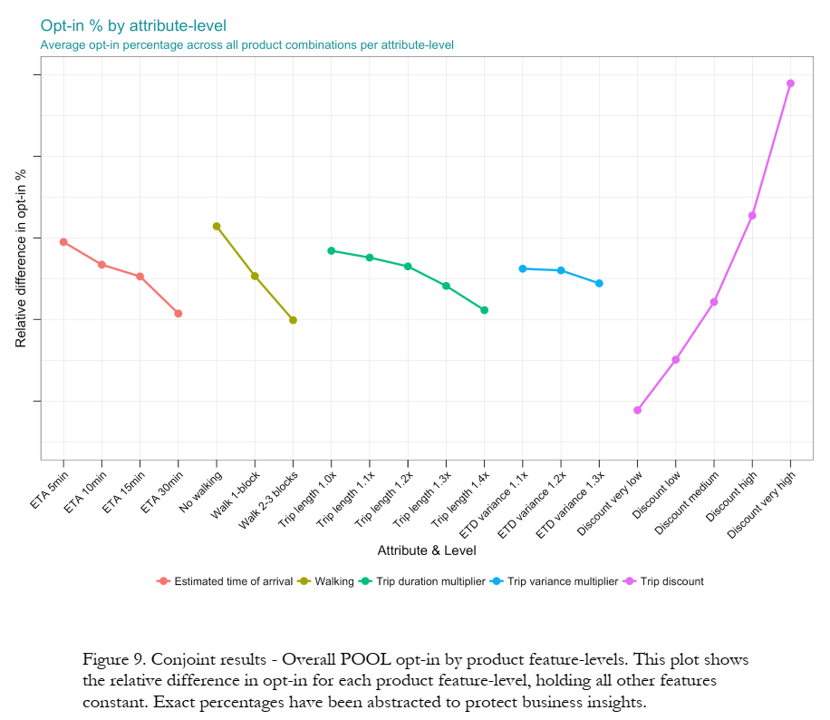
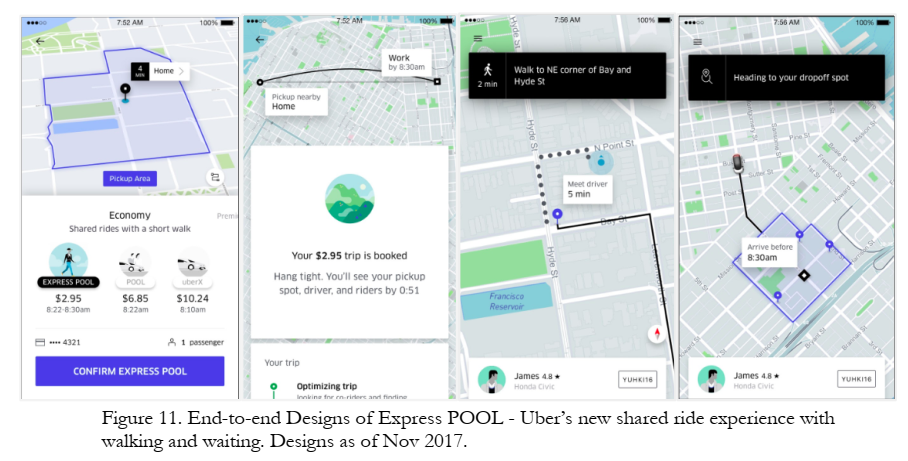
Product Redesign
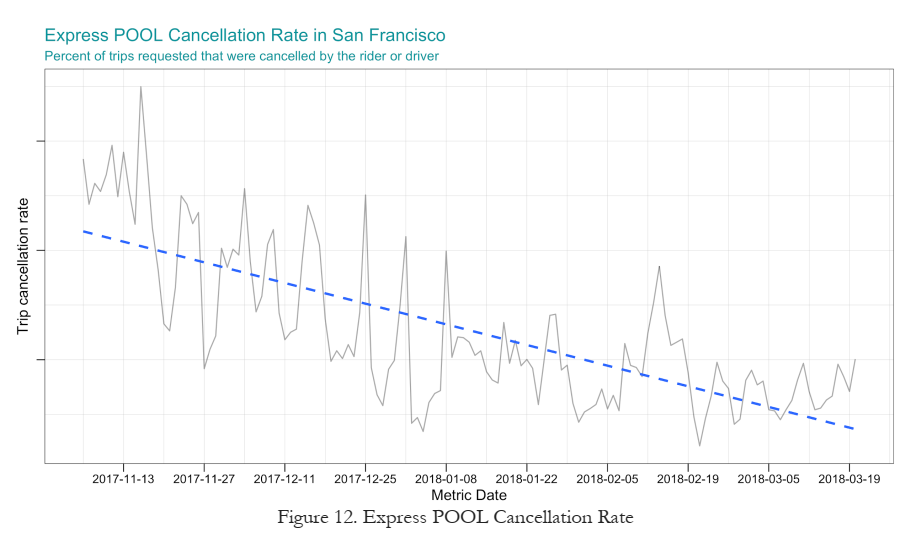
Business Results
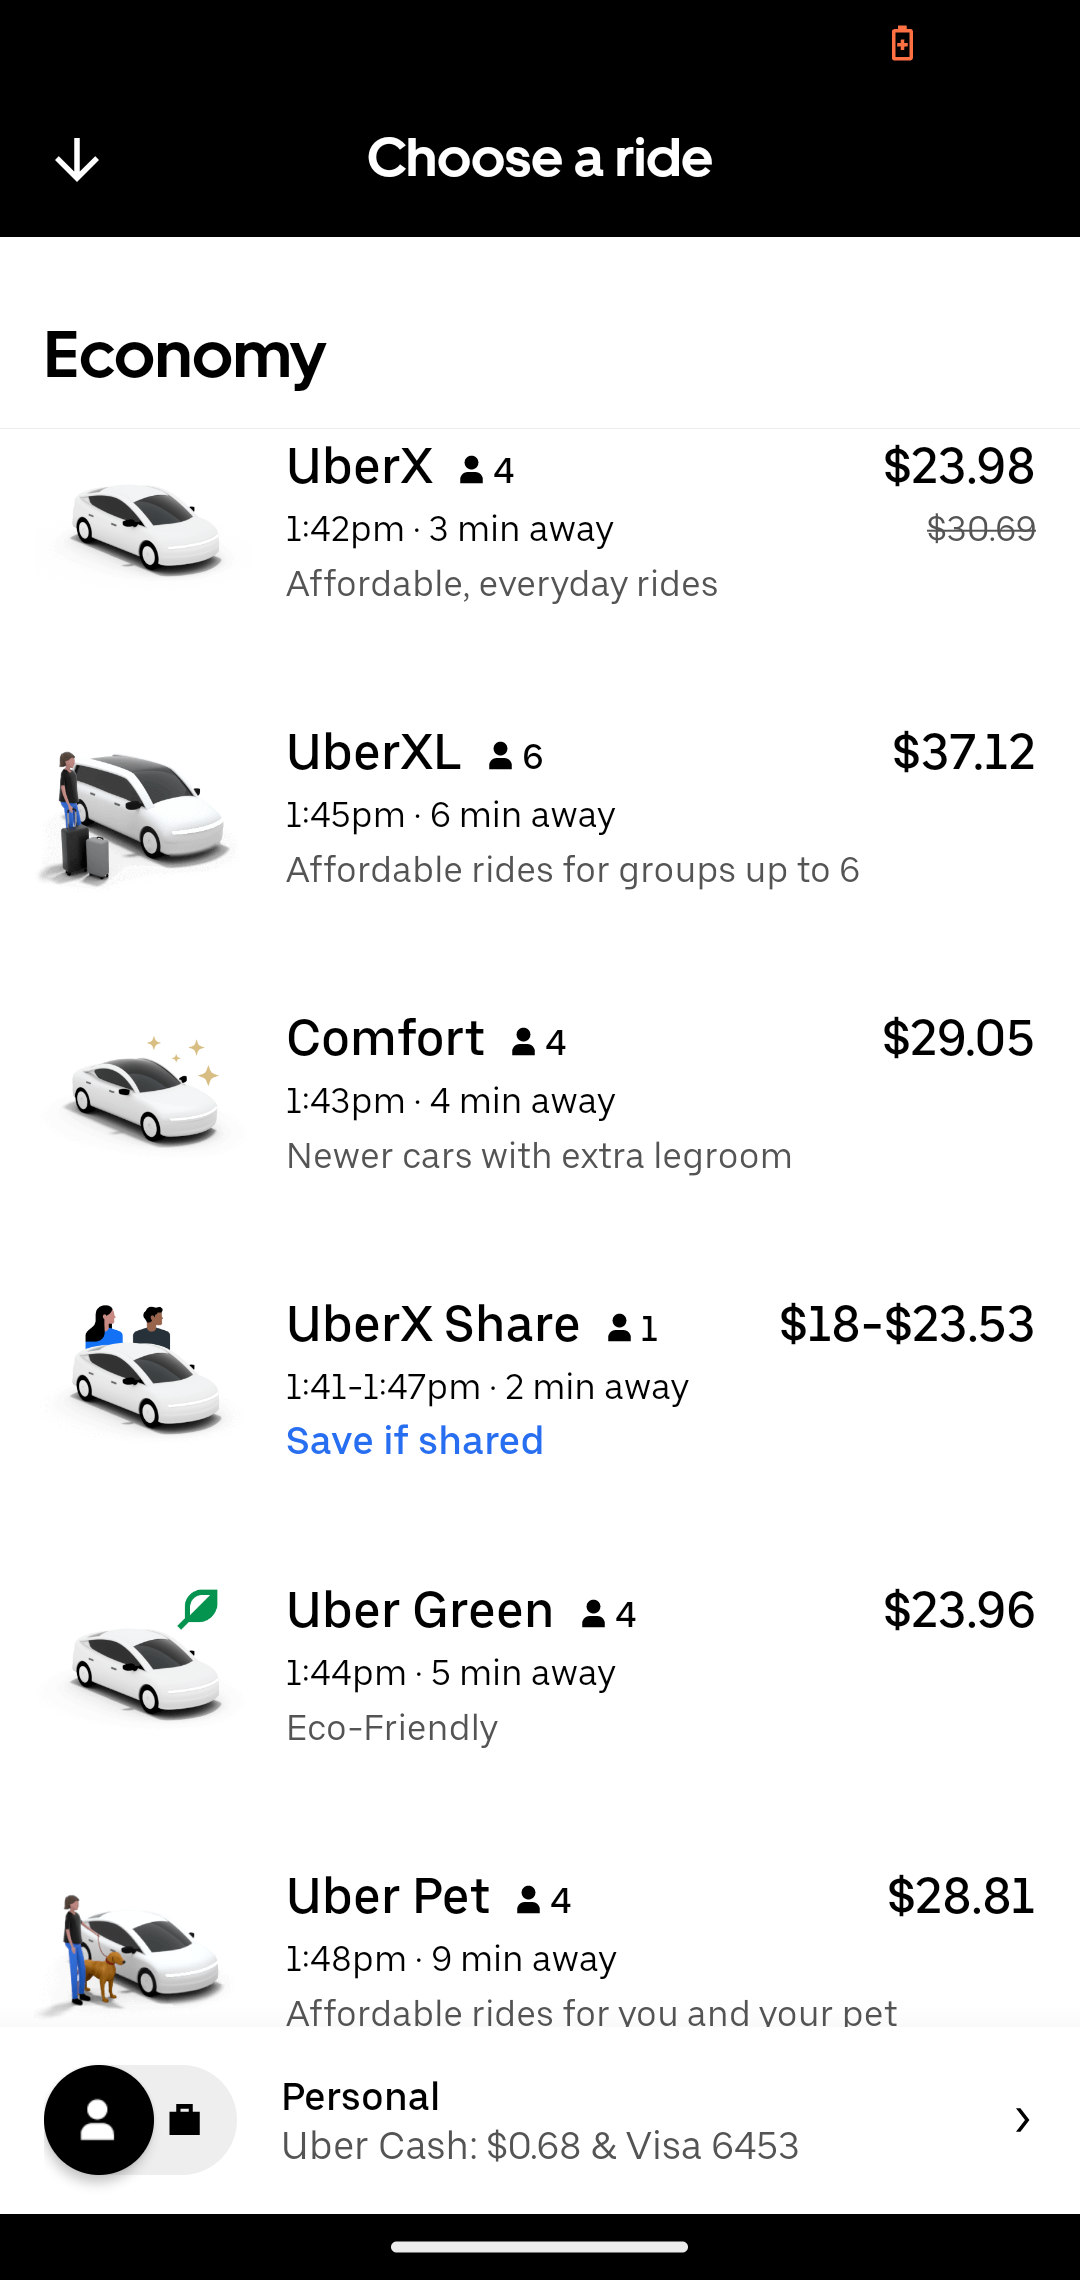
More Products
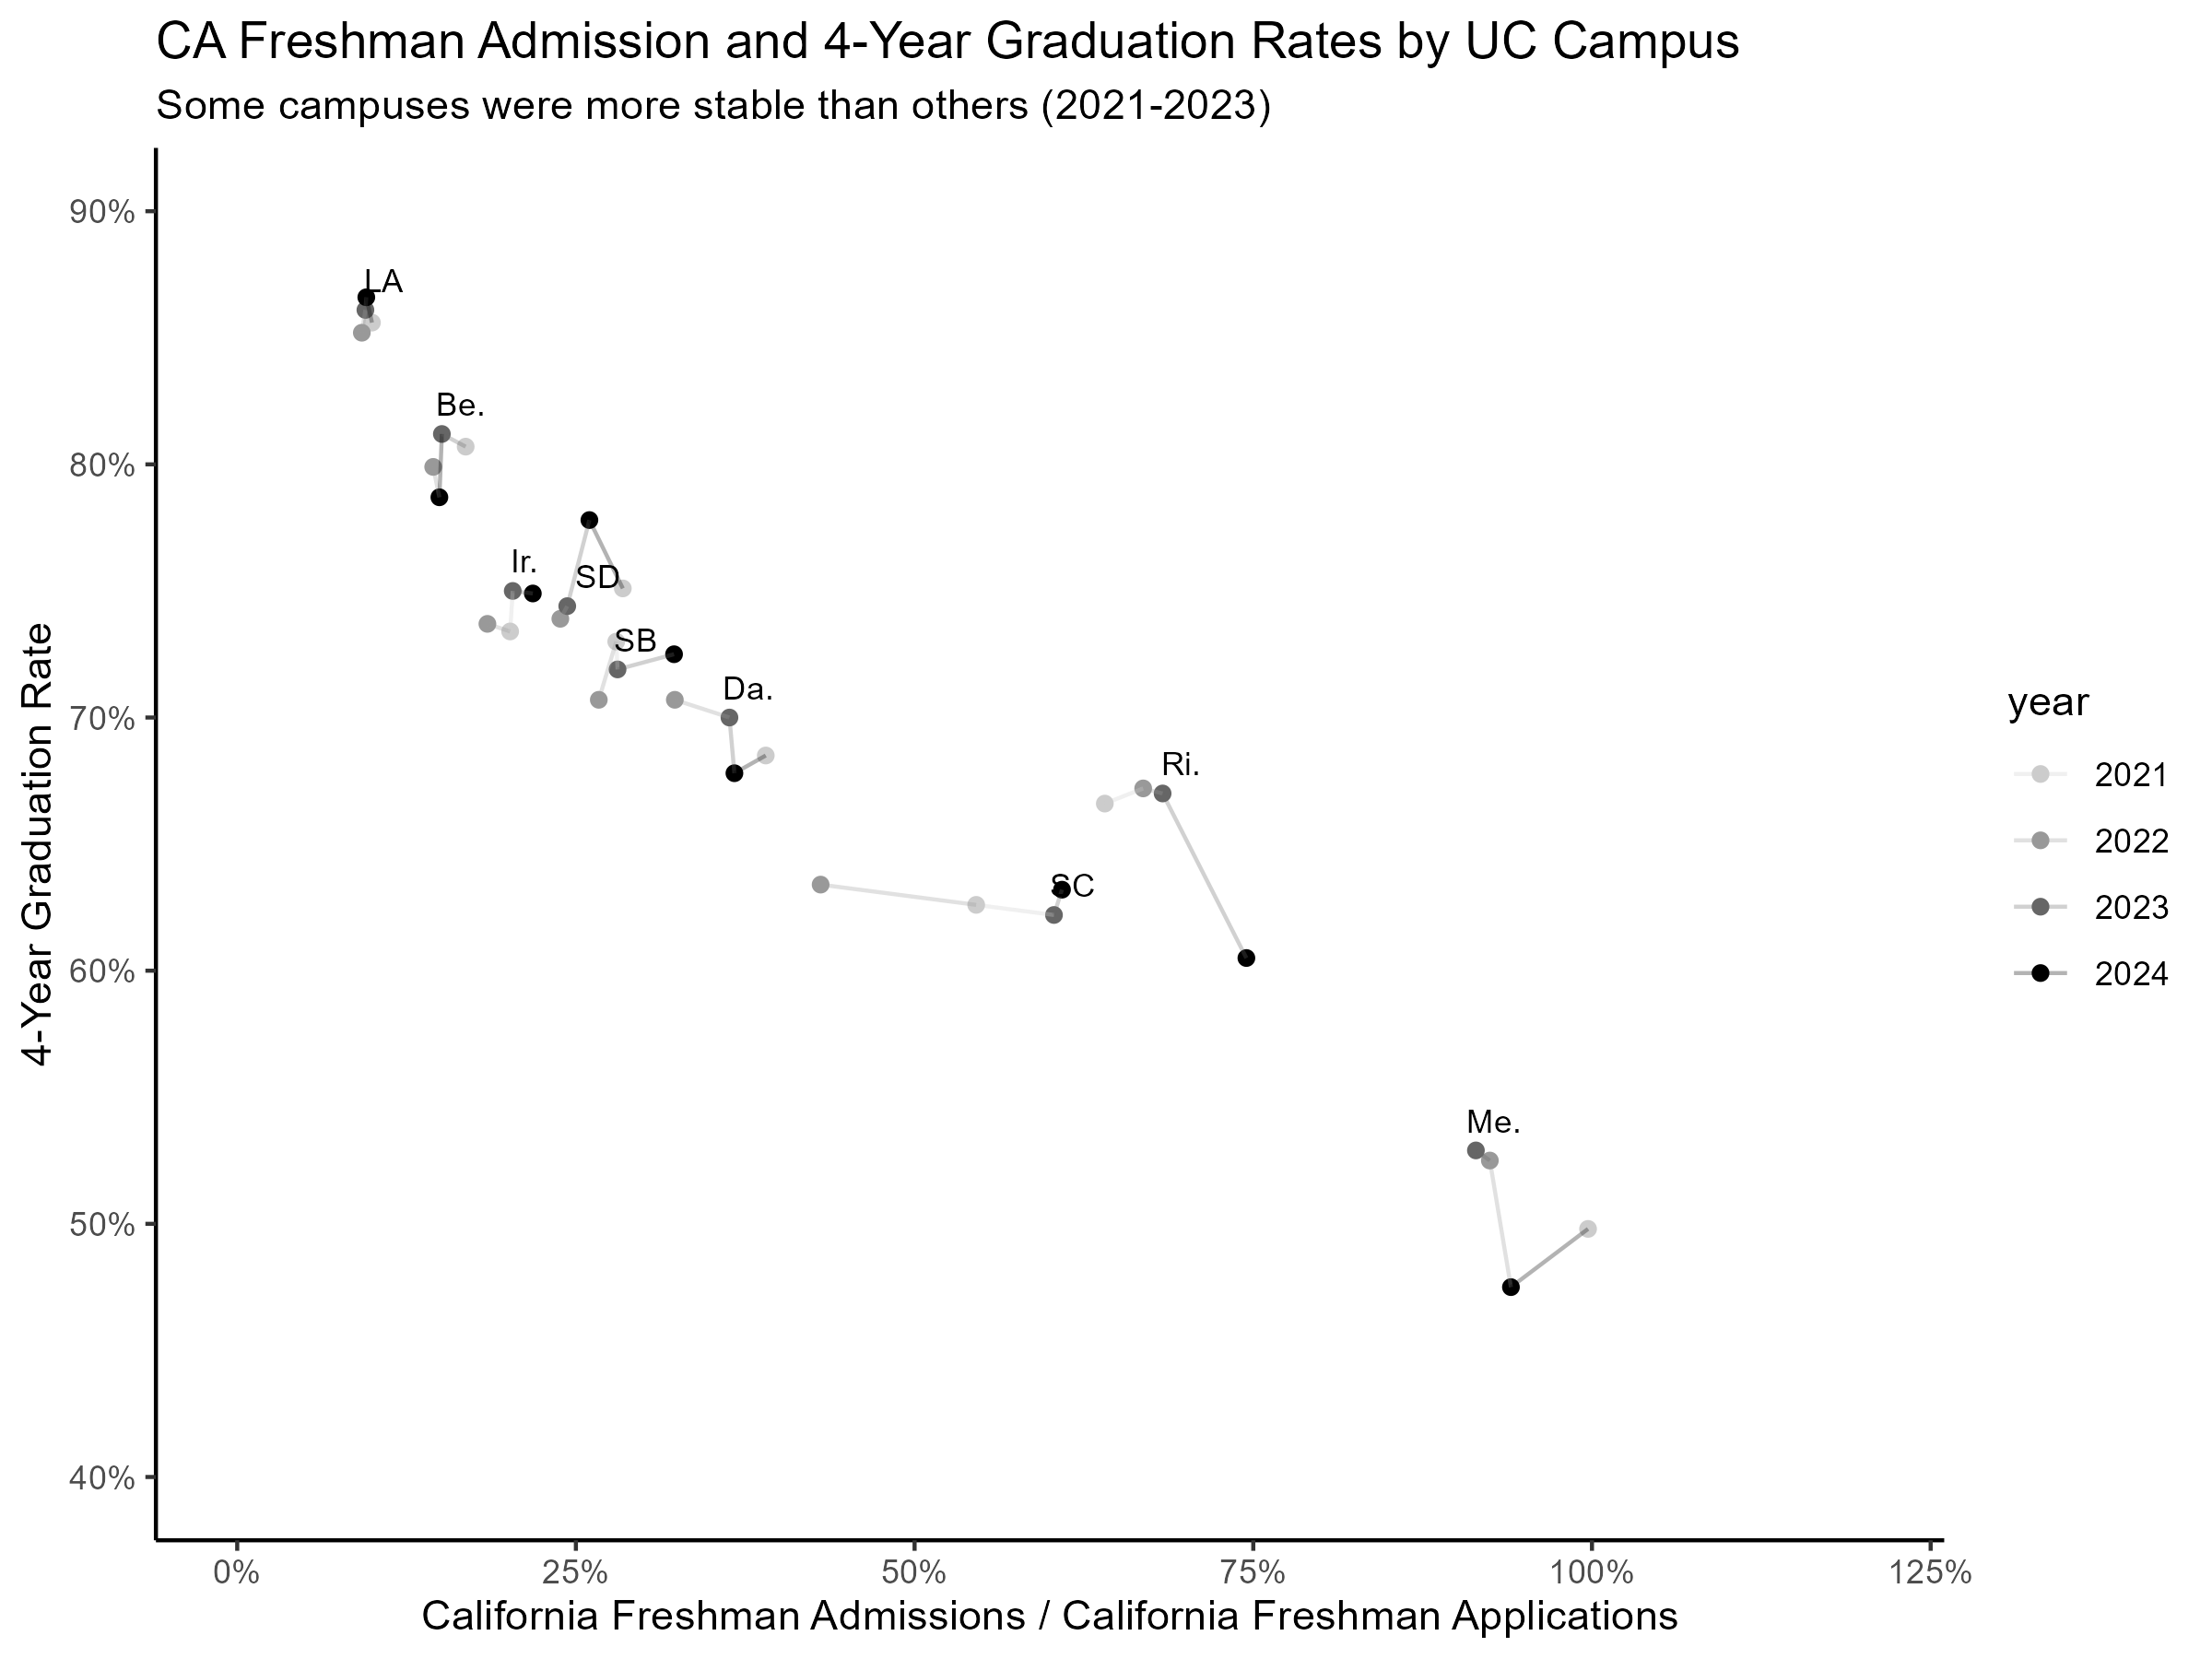
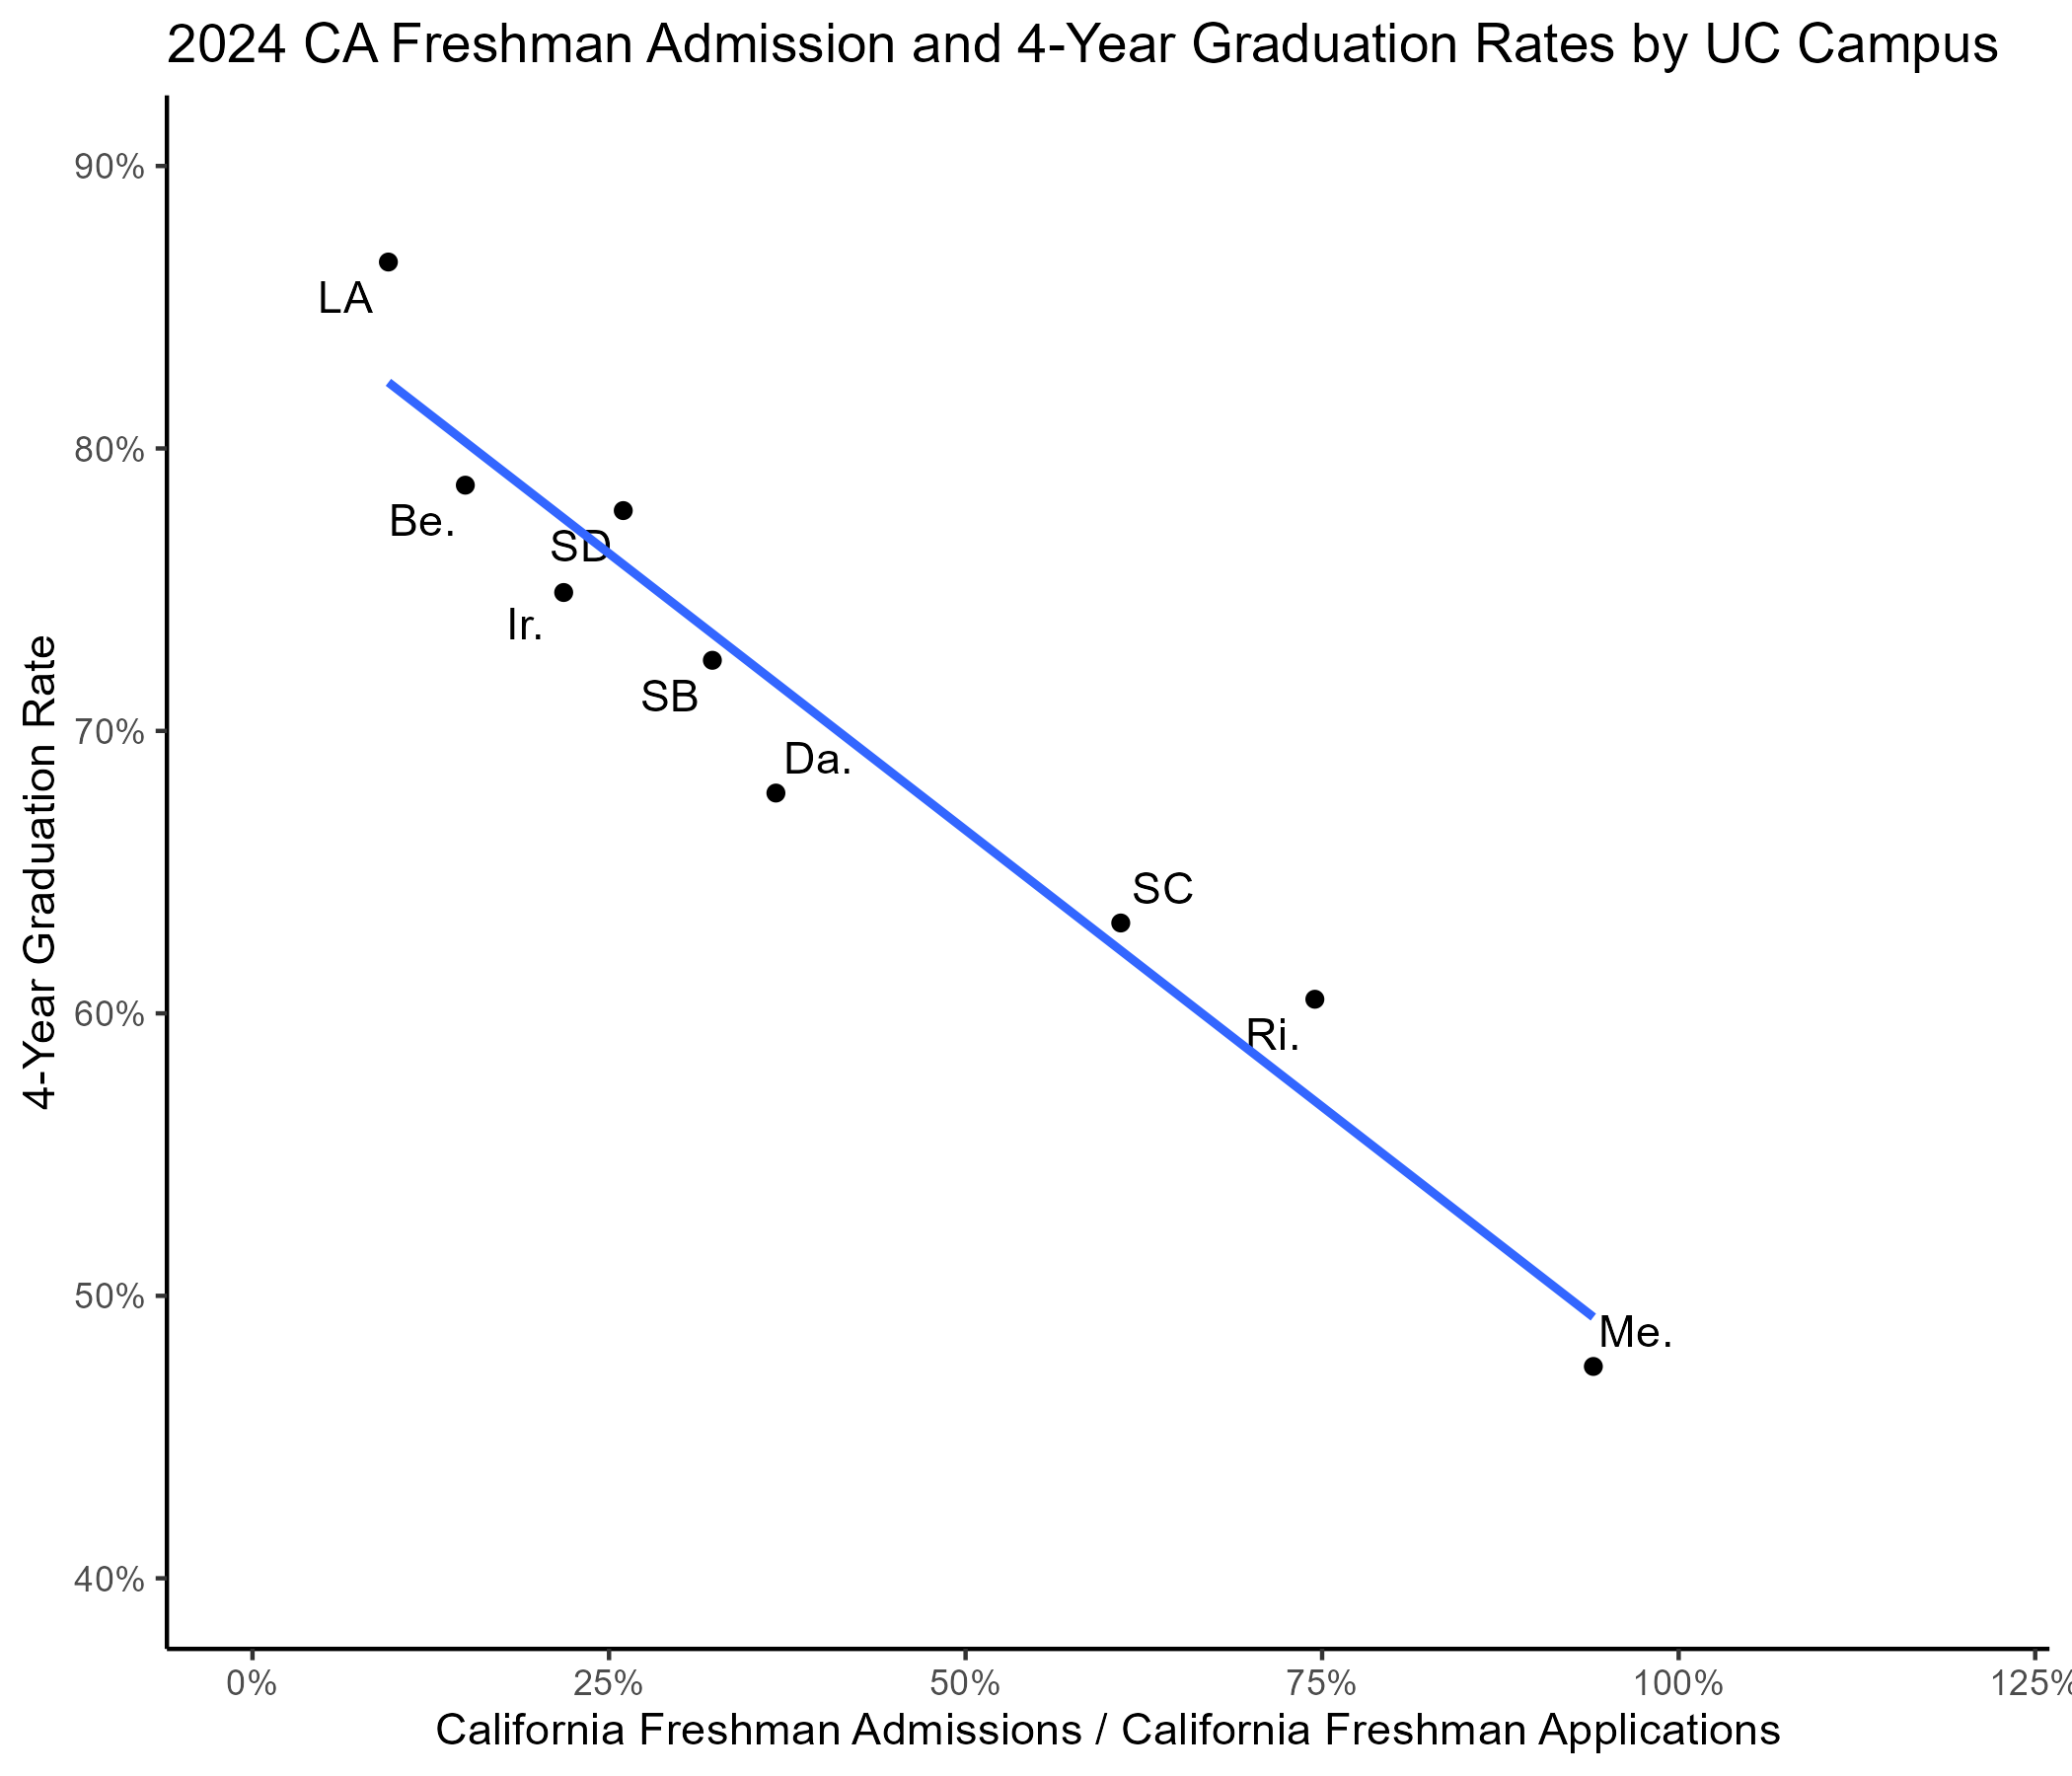
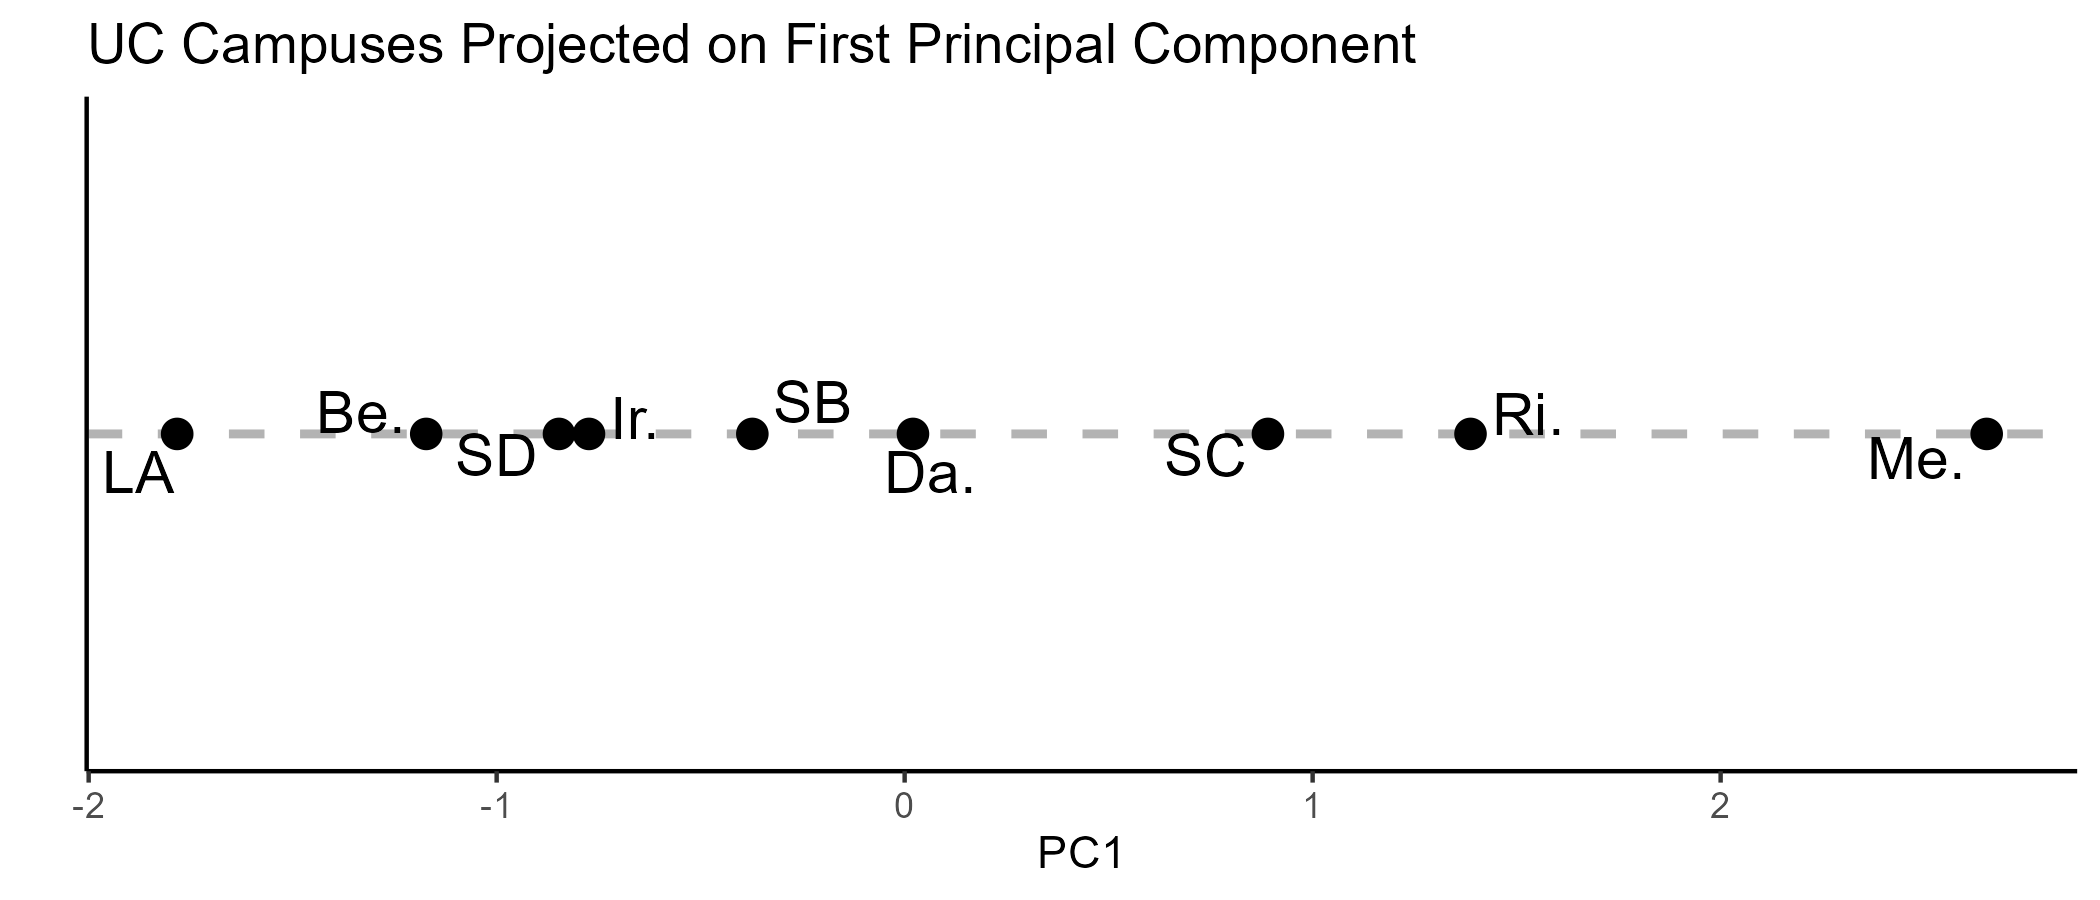
Class script
- Let’s use PCA to draw some product maps.
Homework
- Let’s take a look

Recap
Market maps use customer data to depict competitive situations
PCA projects high dimensional data into lower dimensional space w minimal information loss
Embeddings represent words as points in concept-space, enabling word-math
Conjoint analysis uses survey choice data to
    - map markets
    - estimate product attribute utilities
    - help design products as bundles of attributes
    - predict how location choice leads to revenues, profits

Going further
- Intro to Large Language Models by Karpathy
- ChatGPT: 30 Year History | How AI Learned to Talk
- Mapping Market Structure Evolution by Matthe et al. 2023
- Deeper dive on data reduction: R4MRA, Section 8.2
- MGT 108R to design & run conjoint analyses
- Conjoint literature is huge. Good entry points: Chapman 2015, Ben-Akiva et al 2019, Green 2022, Allenby et al. 2019