Segmentation, Mapping, Text, LLMs
MGT 100 Week 2
This version: May 2026 | License: CC BY 4.0 | We use javascript to track readership.
We welcome reuse with attribution. Please share widely.
Measurable
Substantial

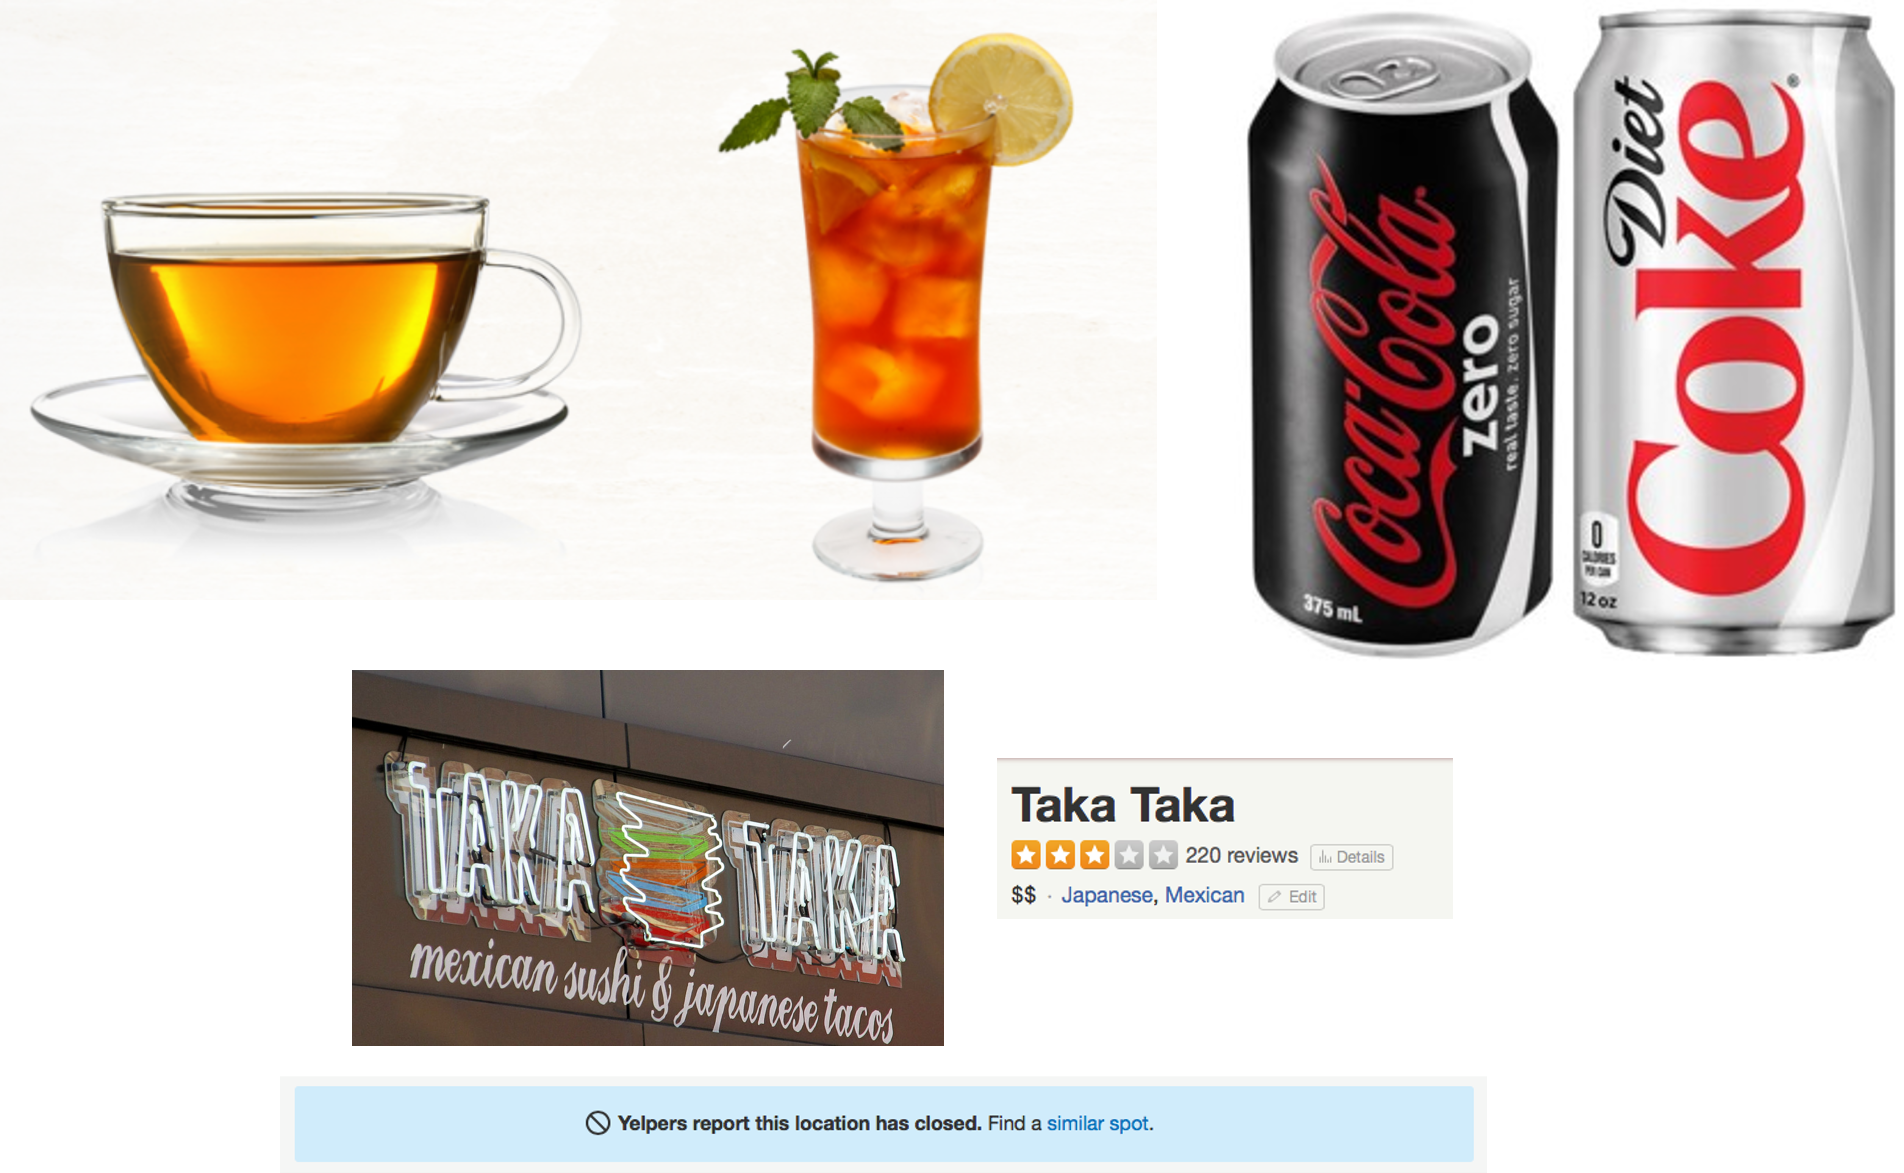
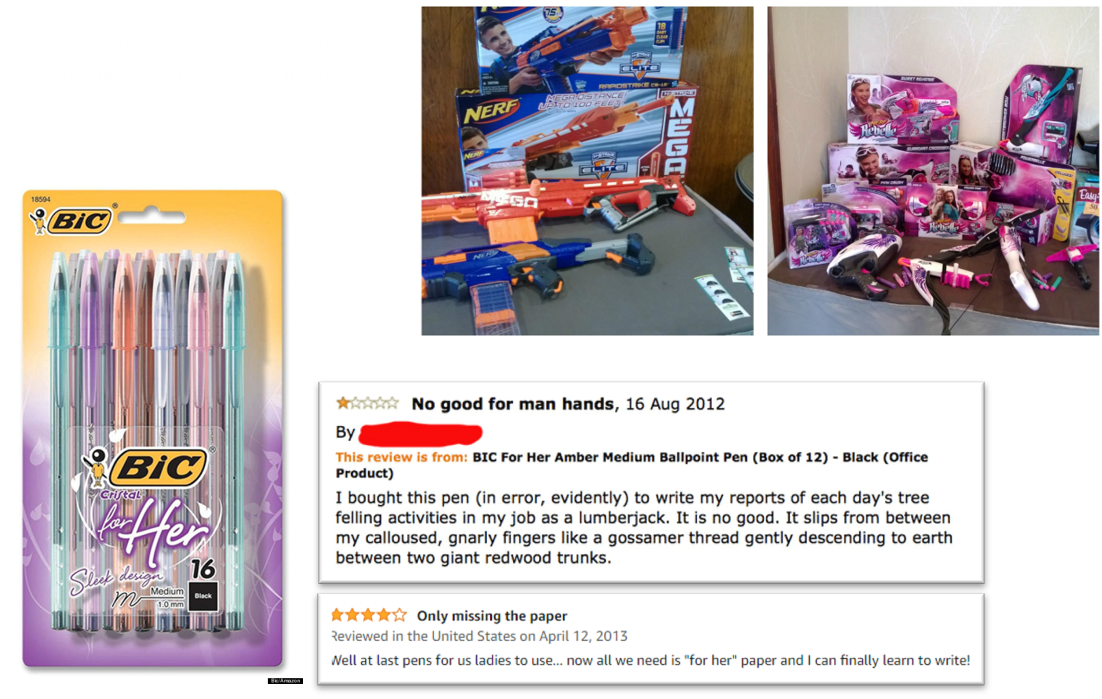
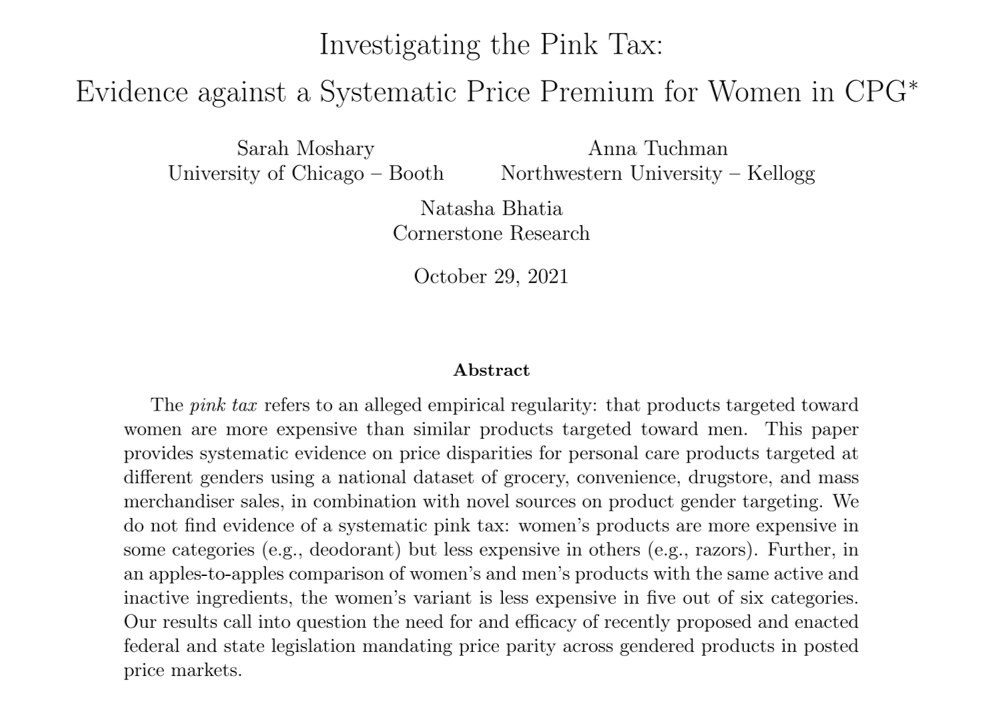
Is segmenting by gender sexist?
![]()
- Walmart divides its market into 9 segments and targets 4. Which ones?
| Low Price Sensitivity |
Mid Price Sensitivity |
High Price Sensitivity |
|
| Low Income | |||
| Mid Income | |||
| High Income |
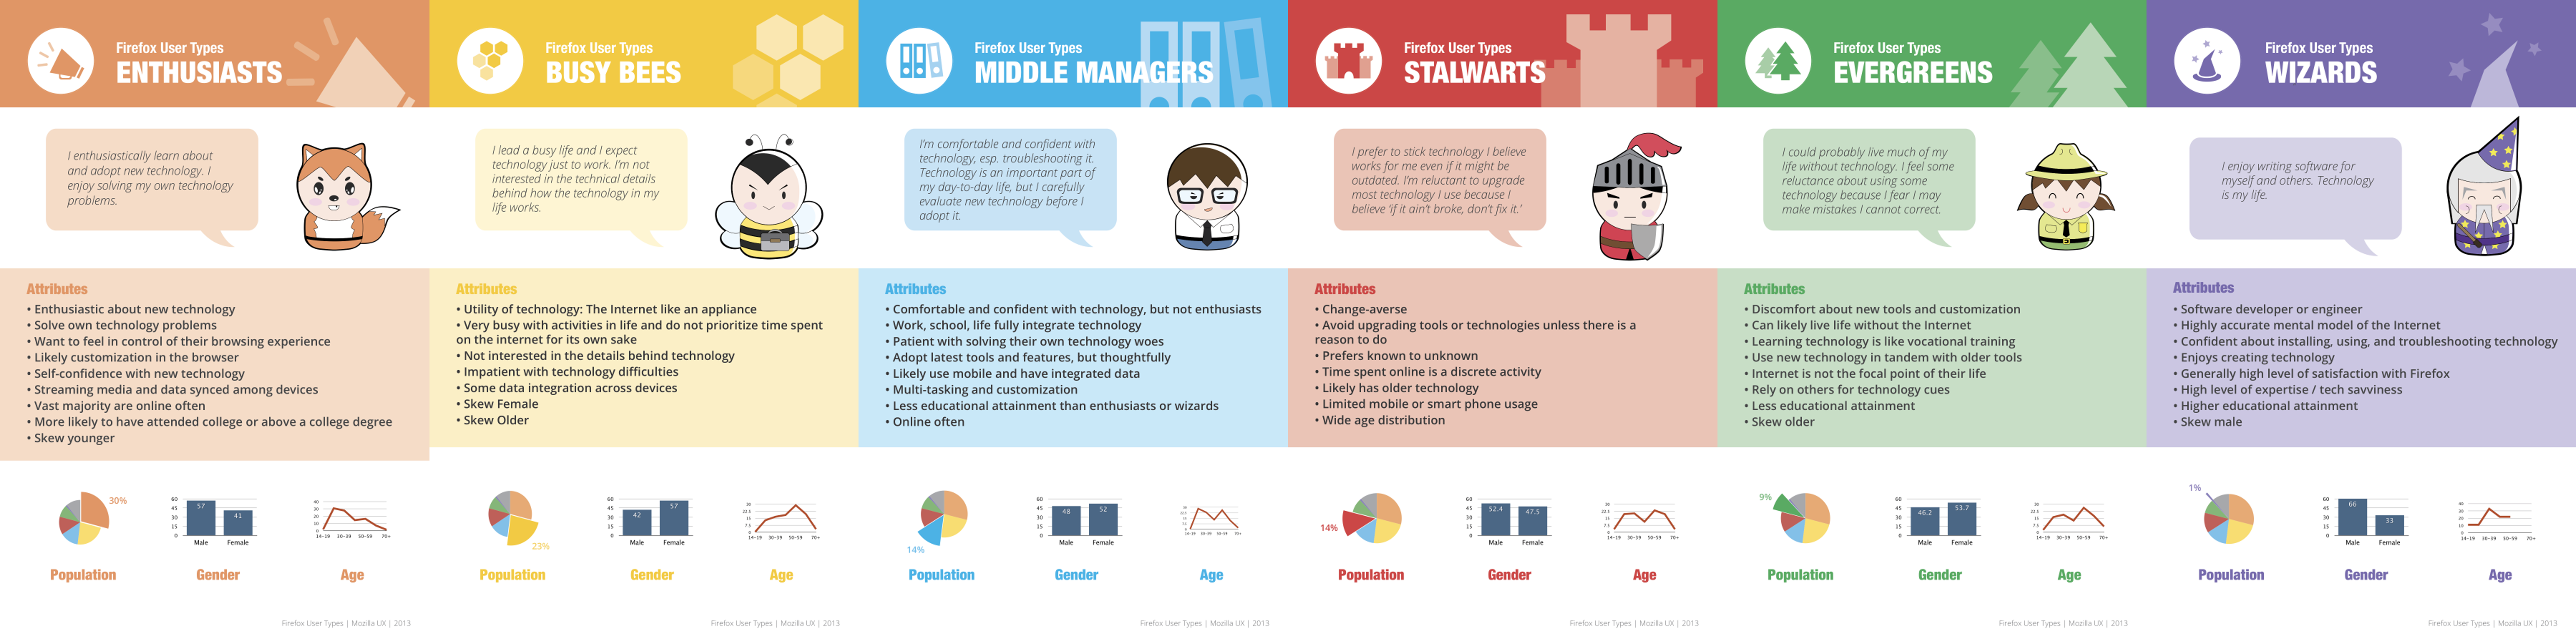
Customer Response Profiles: Firefox Users
- Mozilla’s market research began with customer observations to develop hypotheses; proceeded with in-depth customer interviews to understand motivations for observed behaviors; and concluded with a large survey sample to measure prevalence.
Firms usually obfuscate targeting
- UO website: “We stock our stores with what we love, calling on our — and our customer’s — interest in contemporary art, music and fashion. …
- “We offer a lifestyle-specific shopping experience for the educated, urban-minded individual in the 18 to 30 year-old range…’’
![]()
Firms usually obfuscate targeting
- Earnings call: “Our customer is from traditional homes and advantage, but this offers them the benefit of rebellion…
- Our customer is exposed to new ideas and philosophies. This can be a real involvement and work, or it could be just talk.
- Irreverence and concern can live together. Often products sell well that represent the concerns they have but also can speak to their irreverence.
- Our customer leads a pretty cloistered existence although they deem themselves worldly…they believe that they’re right and they believe that everything that’s happening to them is what’s happening everywhere.
- Our customer is highly involved in mating and dating behavior…one of the primary drives for their spending behavior…they work hard to postpone adulthood… ’’
![]()
How to pick attributes?
- We want to segment based on attributes that drive sales, profit, retention. But how?
- Theory, experience
- Market research
- Customer database
- Consult customer experts (salespeople)
- Find out what other firms are doing
- Let sales data pick for us (het. logit)

Segmentation in Practice
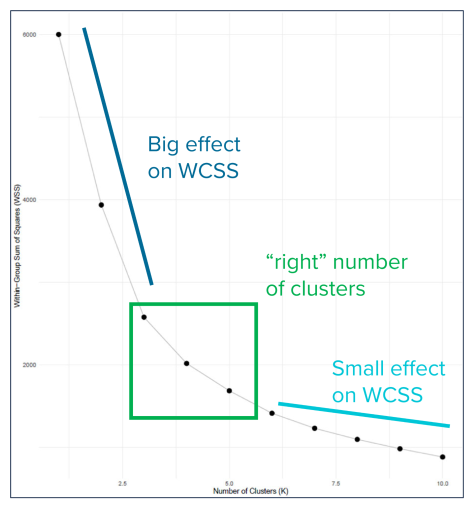
Ways to pick K
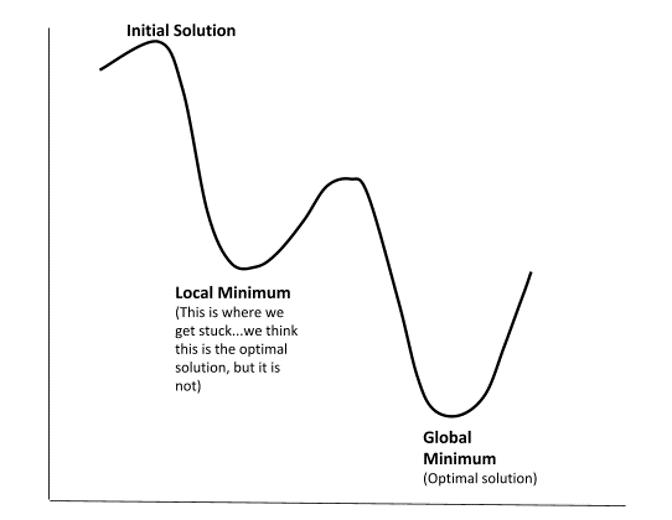
- “Scree Plot” or “Elbow method”: showing how quickly \(W(C_k)\) decreases with \(K\). Can balance accuracy with parsimony, but may be haphazard
- Internal Indices: e.g., run K-Means within distinct data partitions and then quantify how centroid stability changes with \(K\)
- External Indices: compare clustering algorithm results to an external dataset or some source of known truth
Marketing strategy
- Segmentation: How do customers differ
- Targeting: Which segments do we seek to attract and serve
- Positioning
- What value proposition do we present
- How do our product’s objective attributes compare to competitors
- Where do customers perceive us to be
- How do we want to influence consumer perceptions
- Market mapping enables Positioning
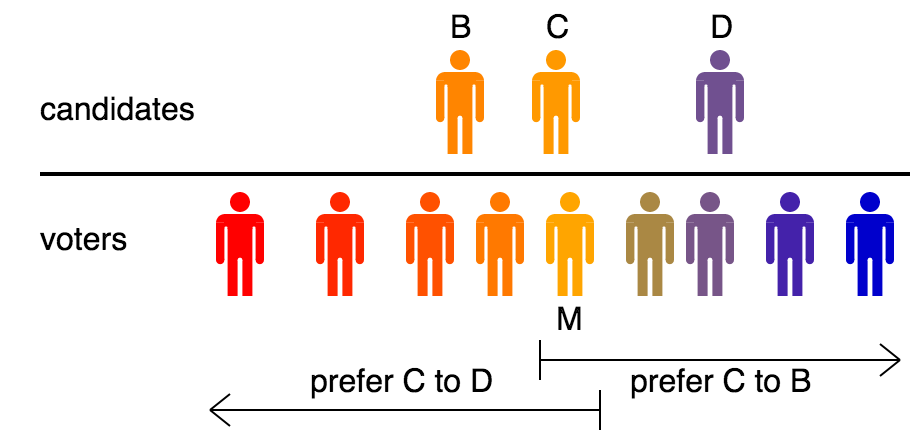
Hotelling (1929)
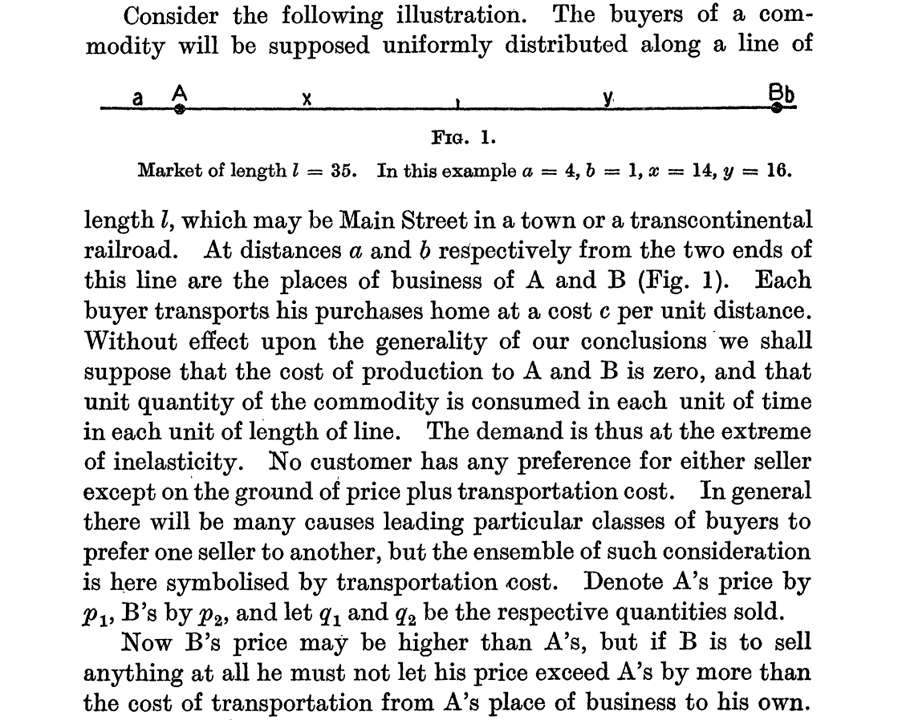
Ice cream vendors
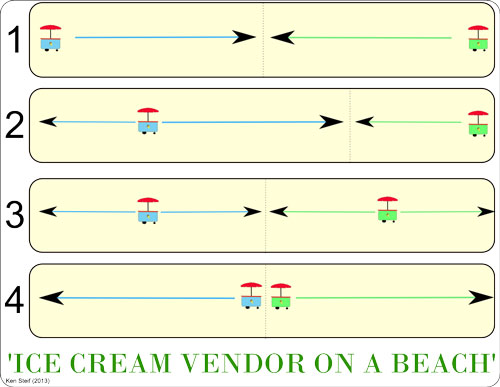
Median voter theorem
Conceptual organization
Mapping Practicalities
- How to measure intangible attributes like trust?
- Survey consumers, e.g. “How much do you trust this brand?”
- What if we don’t know, or can’t measure, the most important attributes?
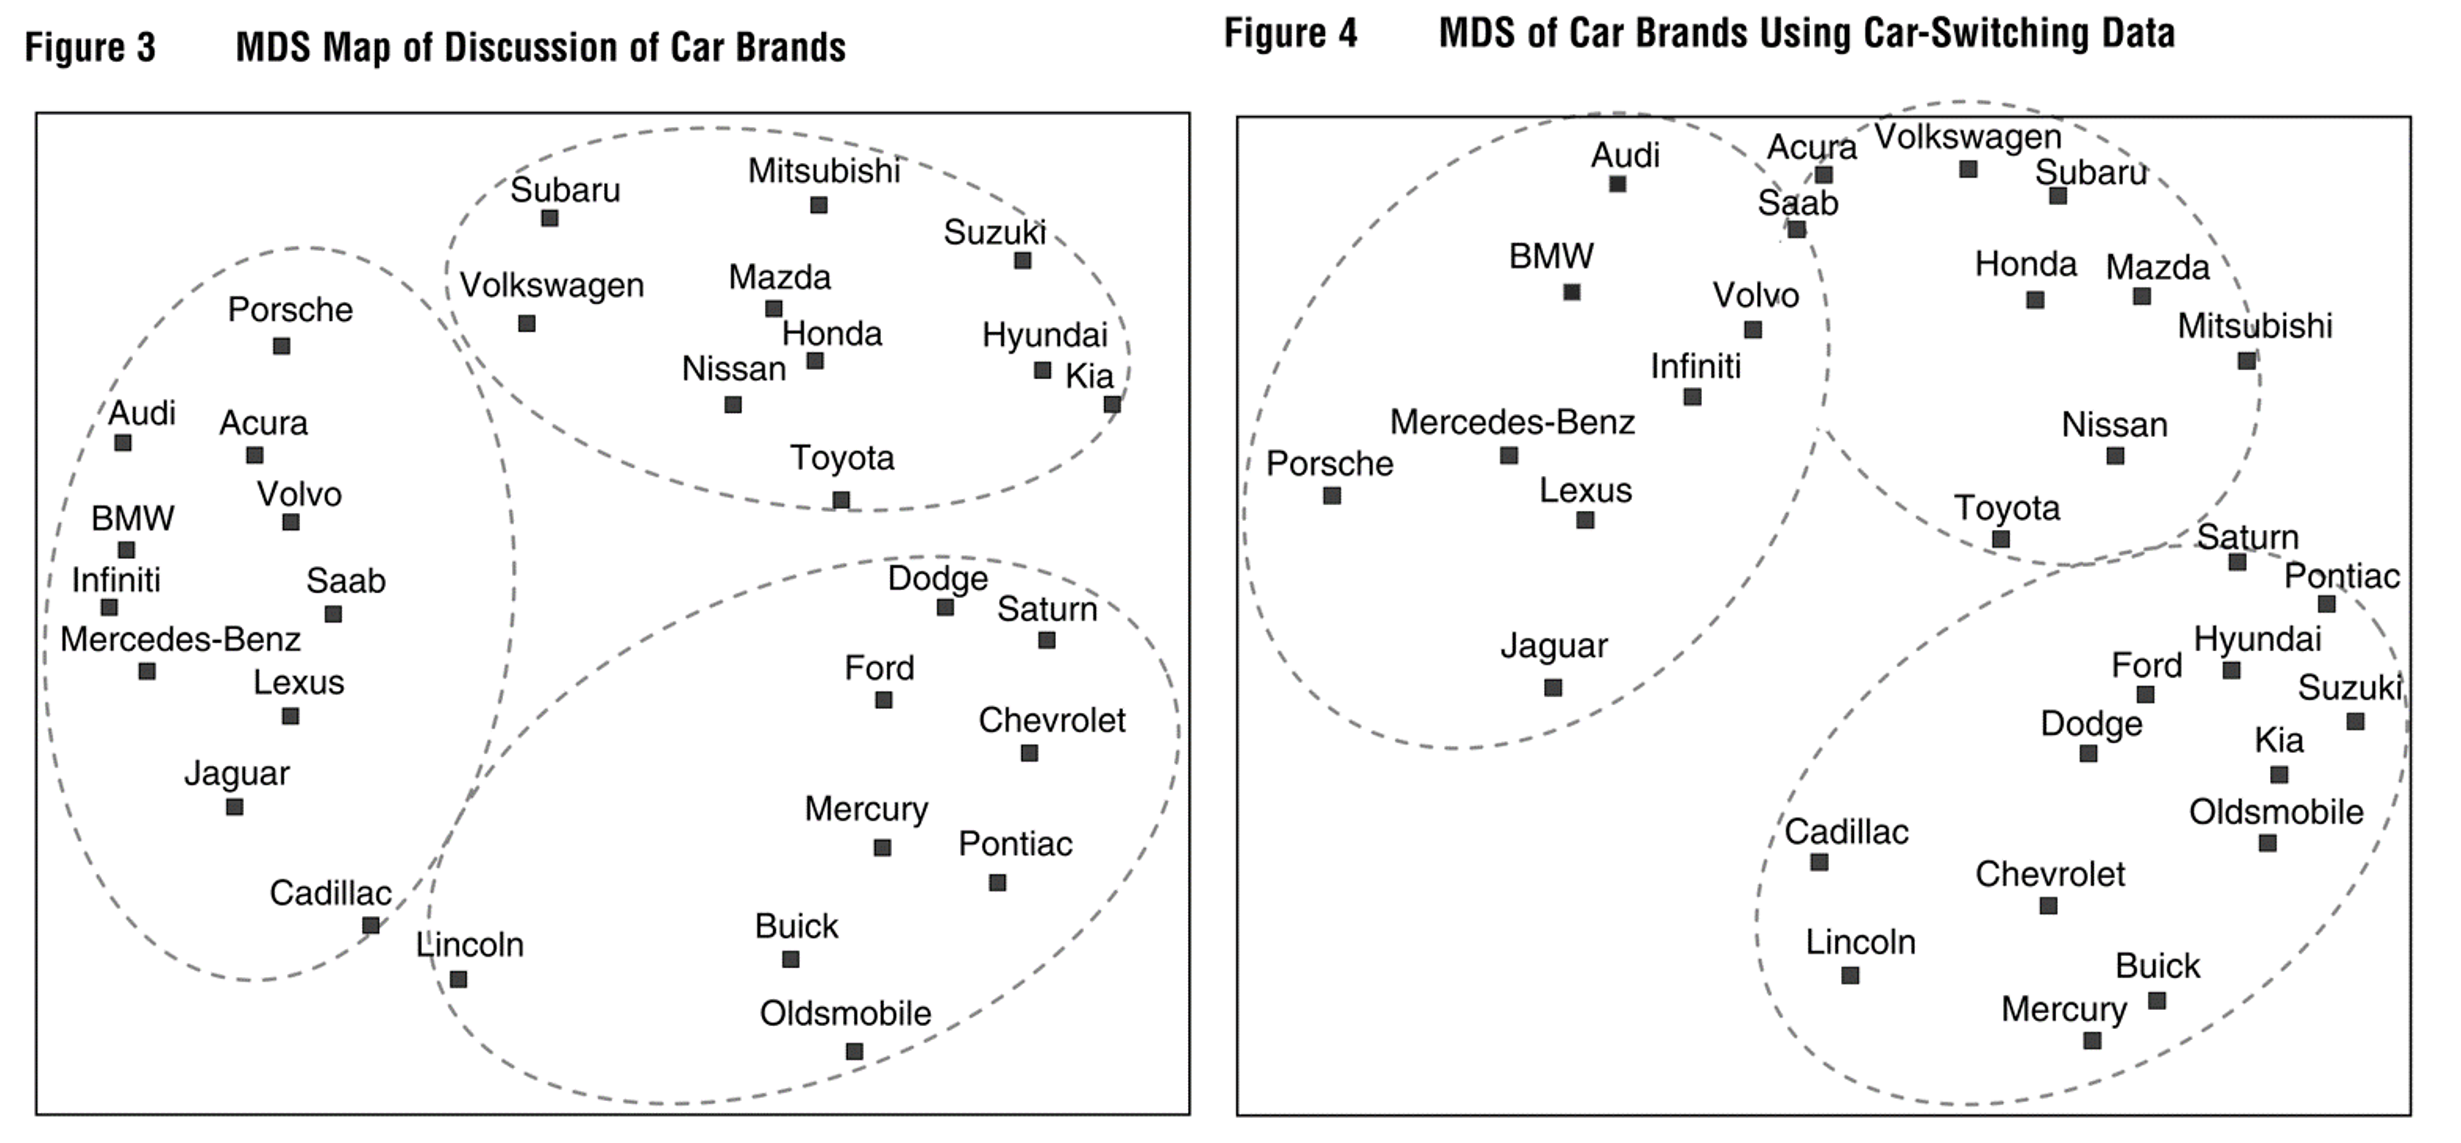
- Multidimensional scaling
- How should we weigh attributes?
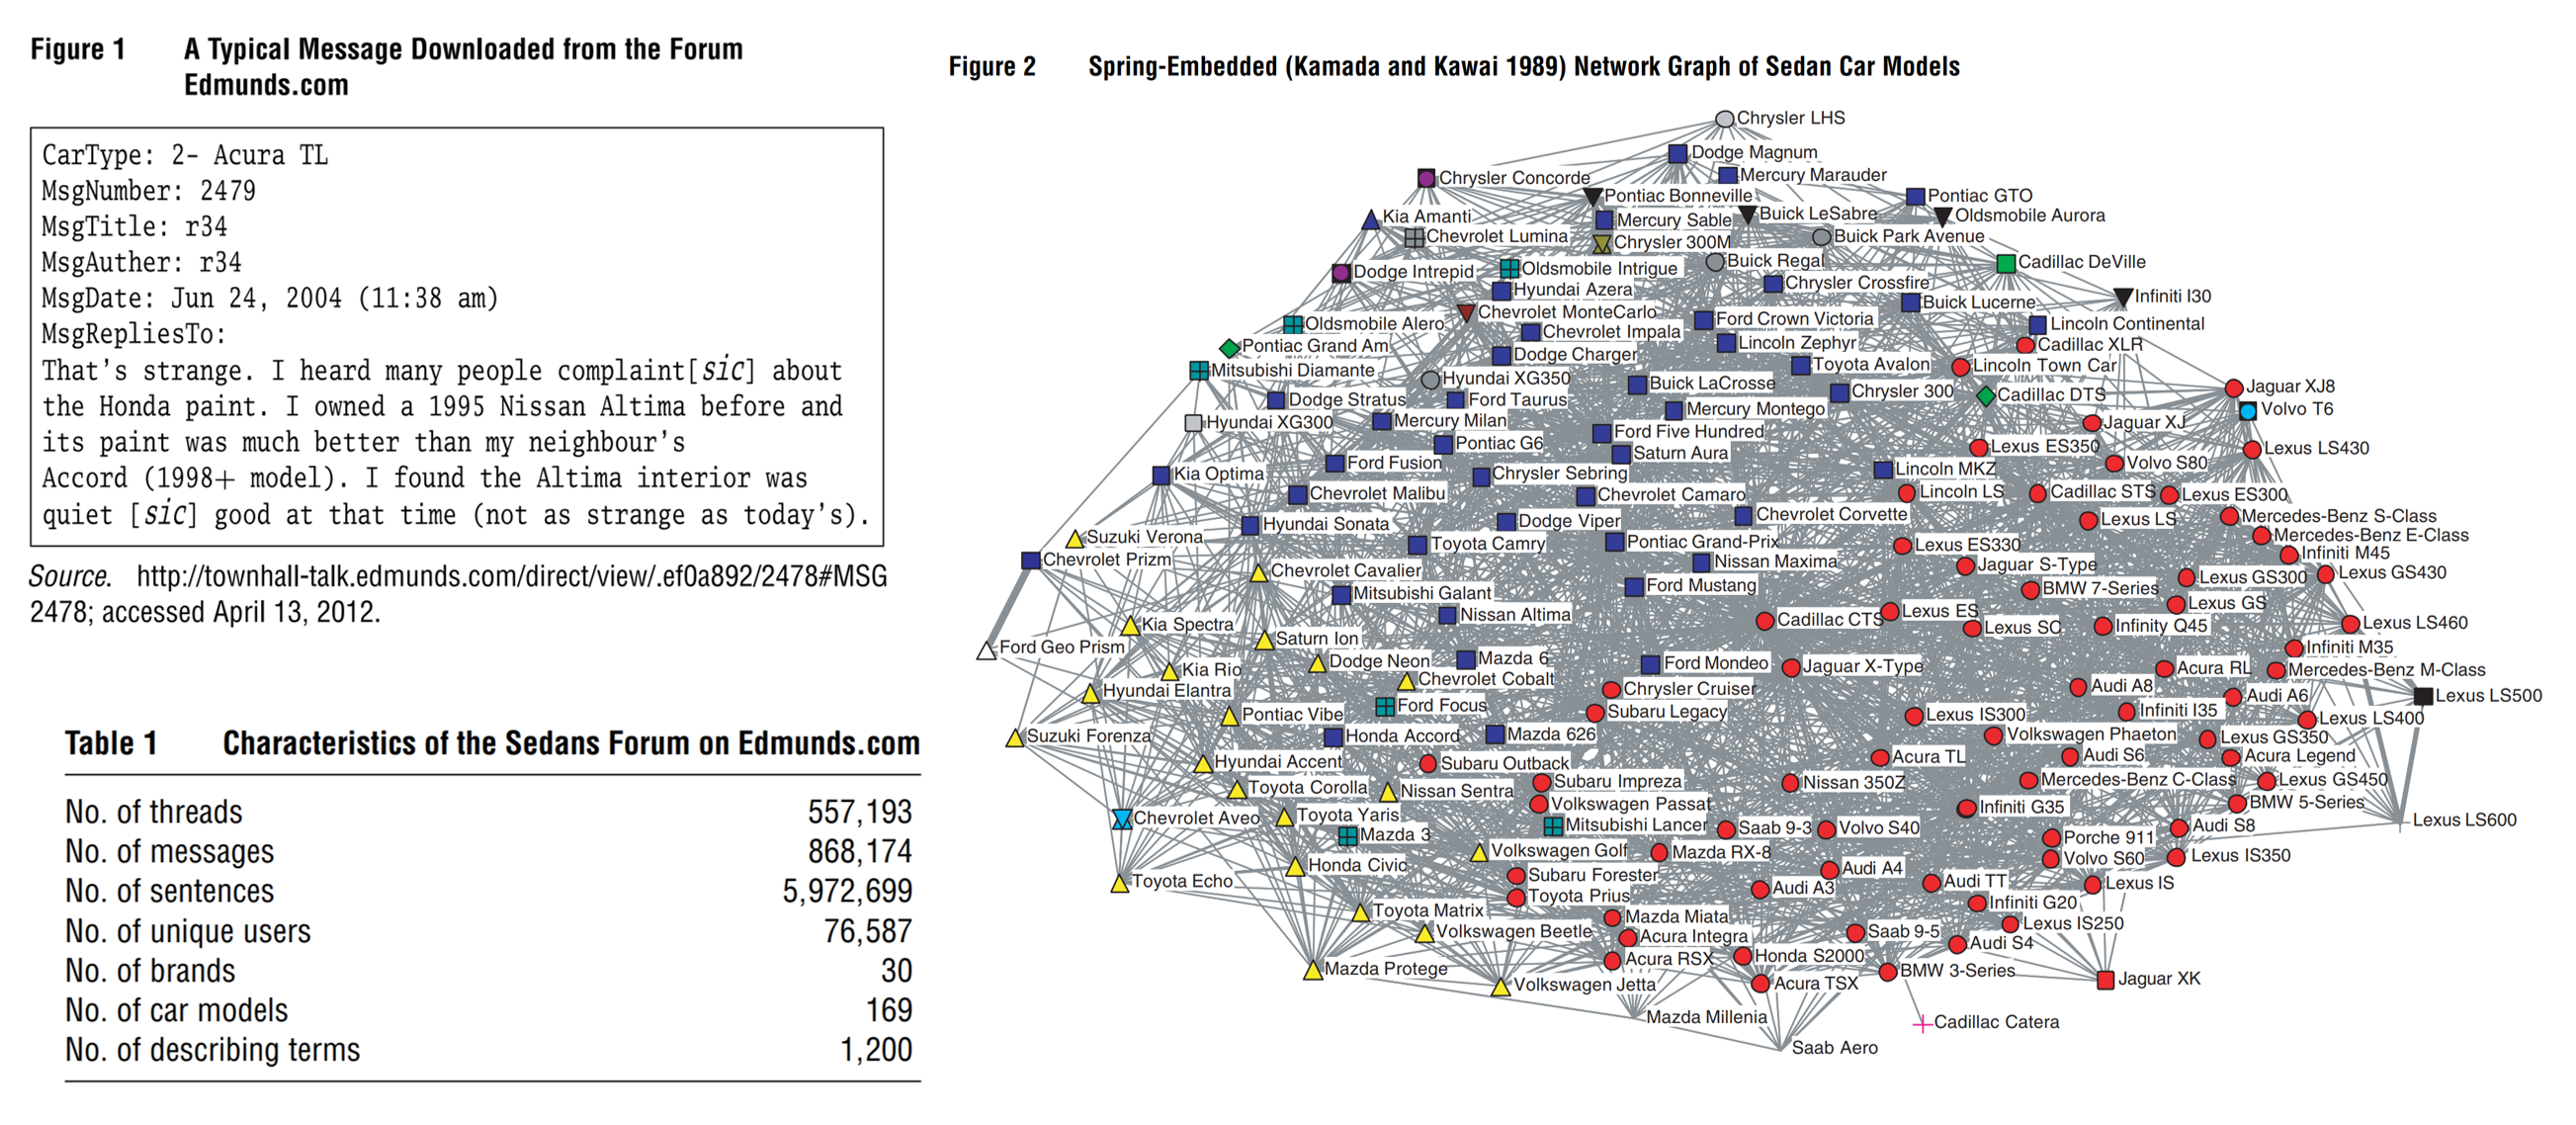
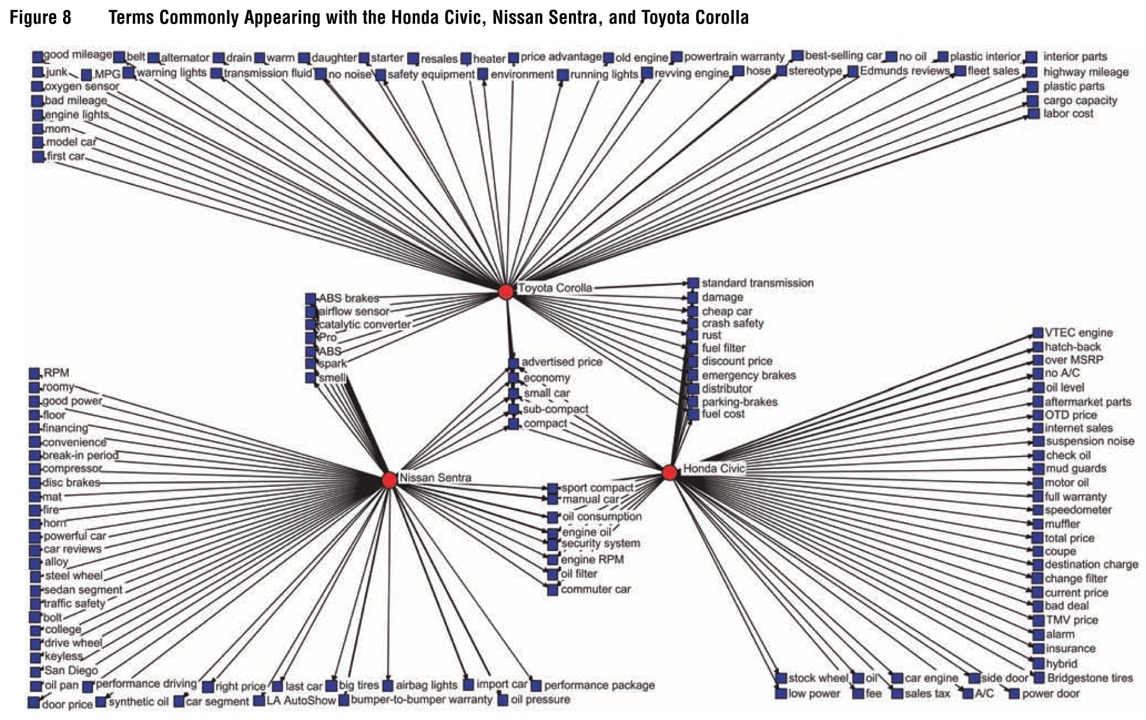
Example: Netzer et al. (2012)
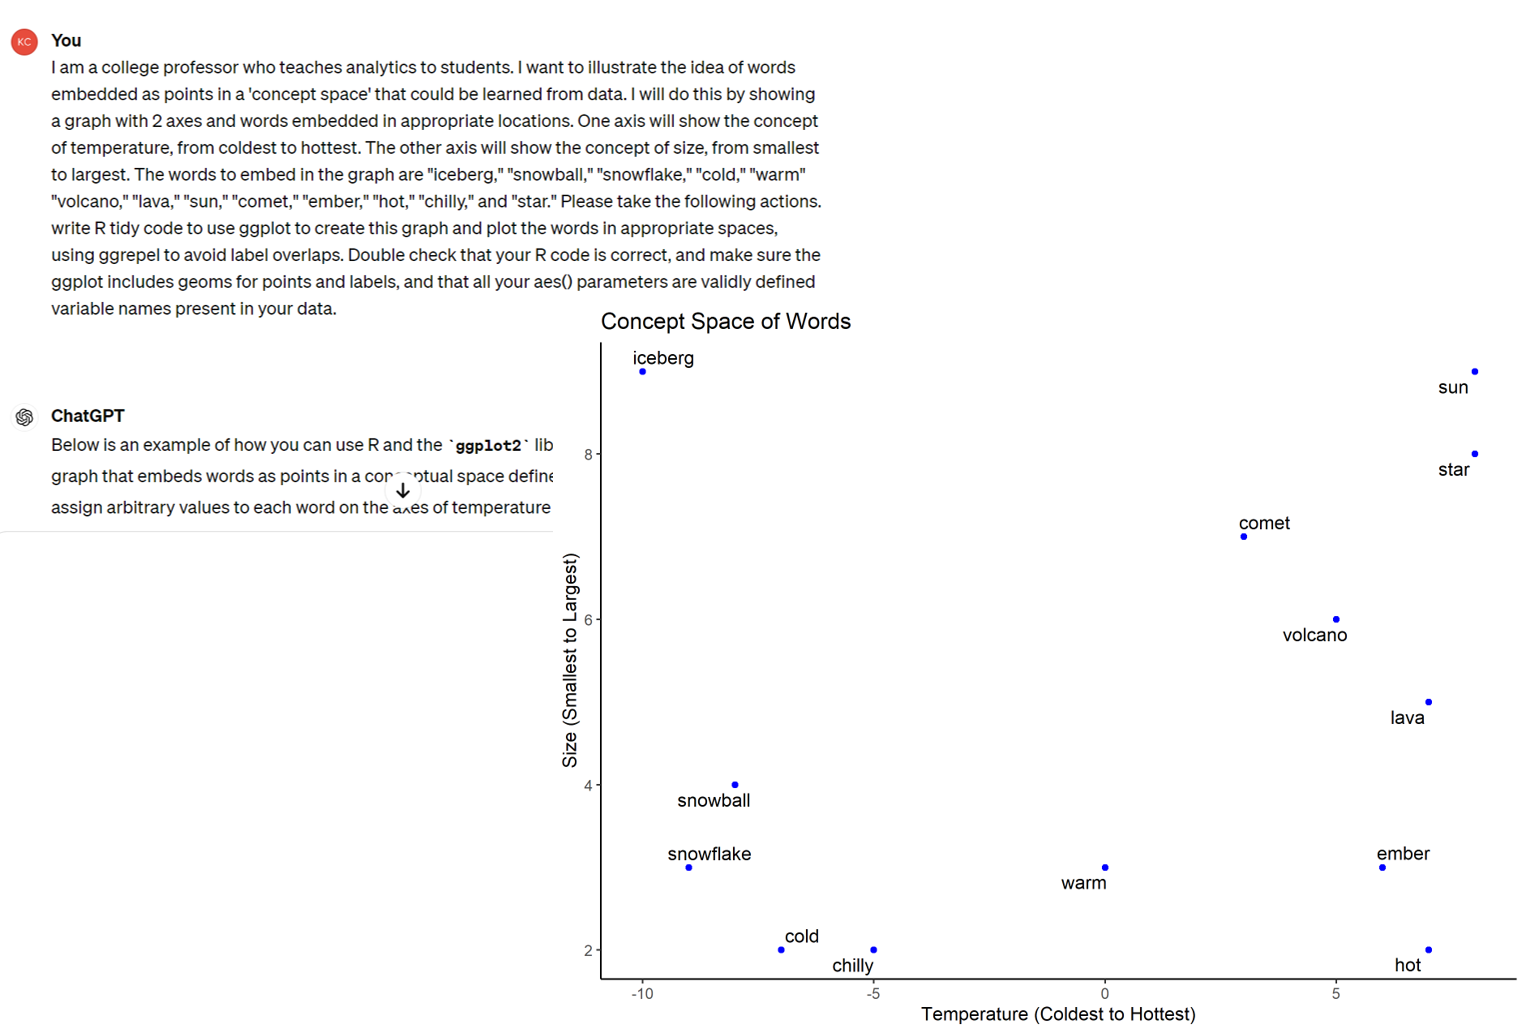
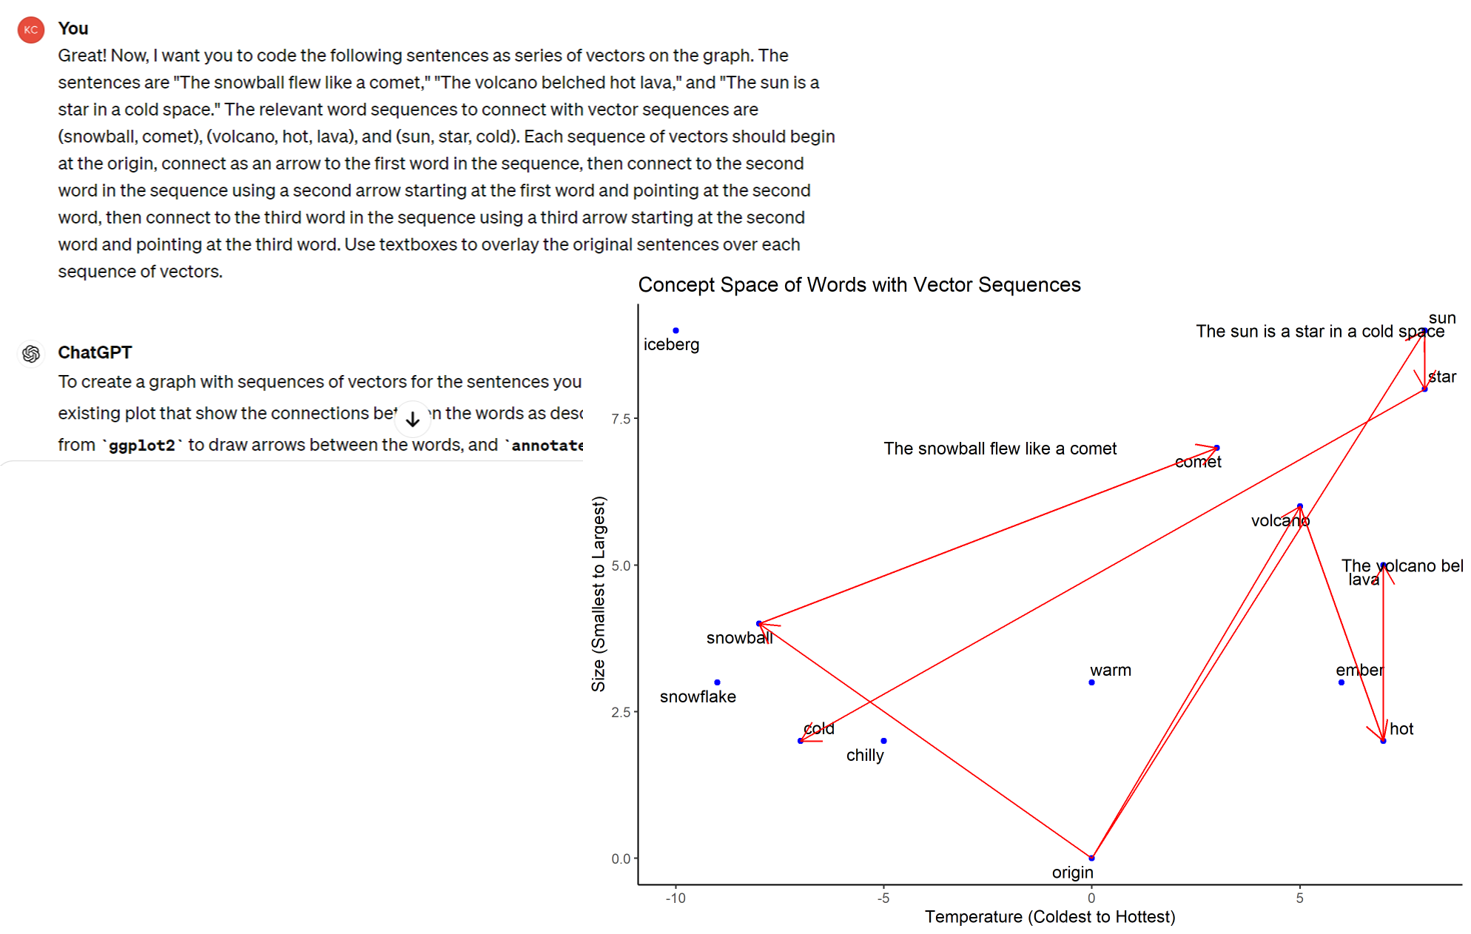
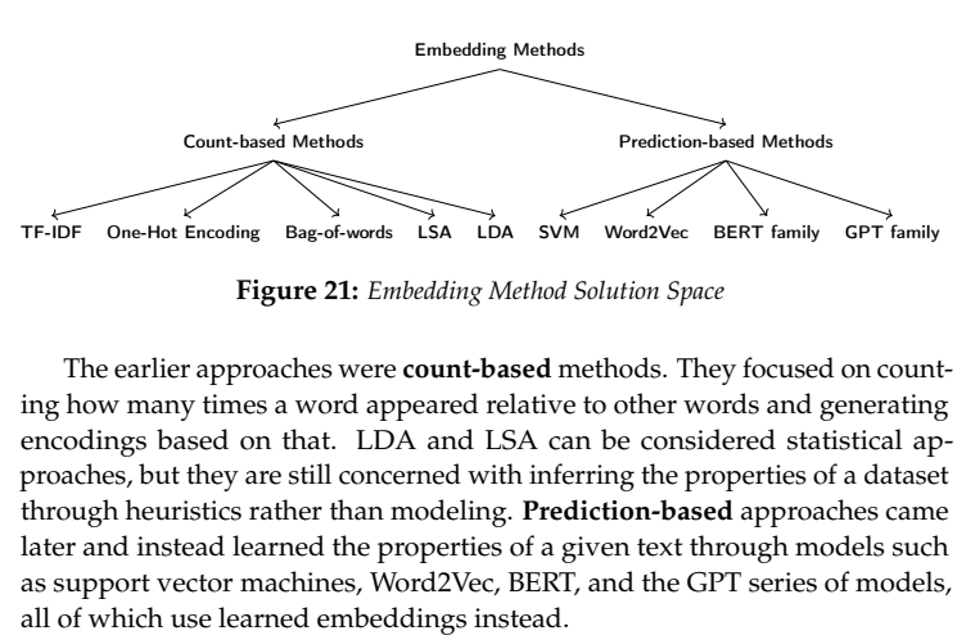
Embeddings
- Represent words as vectors in high-dim space. Really, “tokens,” but assume words==tokens for simplicity
- Assume \(W\) words, \(A<W\) abstract concepts. Assume we have all text data from all history. Each sentence is a point in \(W\)-dimensional space, with each coordinate \(w=1,...,W\) indicating a count of word \(w\) within the sentence
- We could run PCA to reduce from \(W\) to \(A\) dimensions. We have now encoded every sentence as a point in continuous A-space using a ‘bag-of-words’ approach
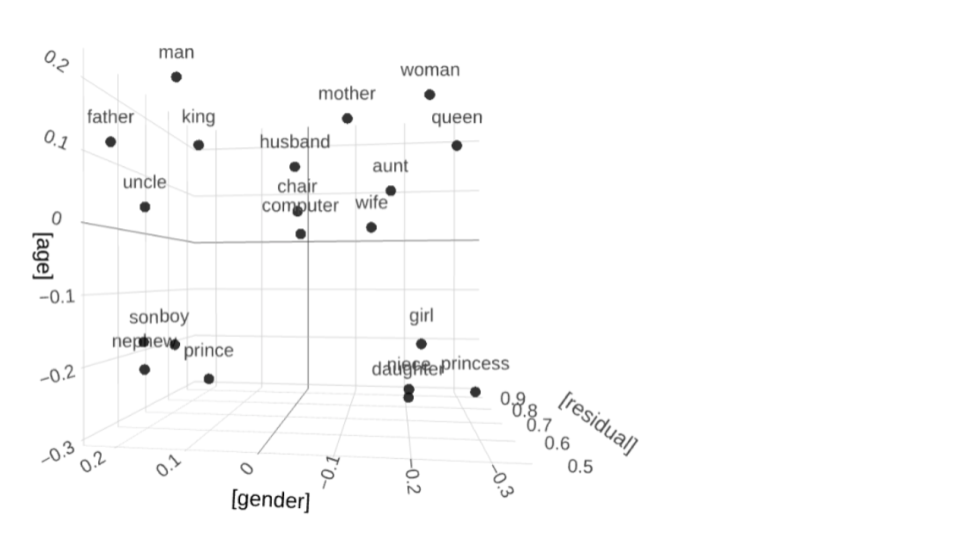
Cool things about embeddings
- We can do math using words!

Many ways to encode embeddings
RLHF
- Reinforcement Learning is a statistical paradigm to learn optimal actions for a given environment, action space and reward space
- HF refers to Human Feedback, which is generated through market research in which humans indicate which sequence completions are best
![]()
Class script
- Standardizing variables
- Iris example
- Running & graphing kmeans
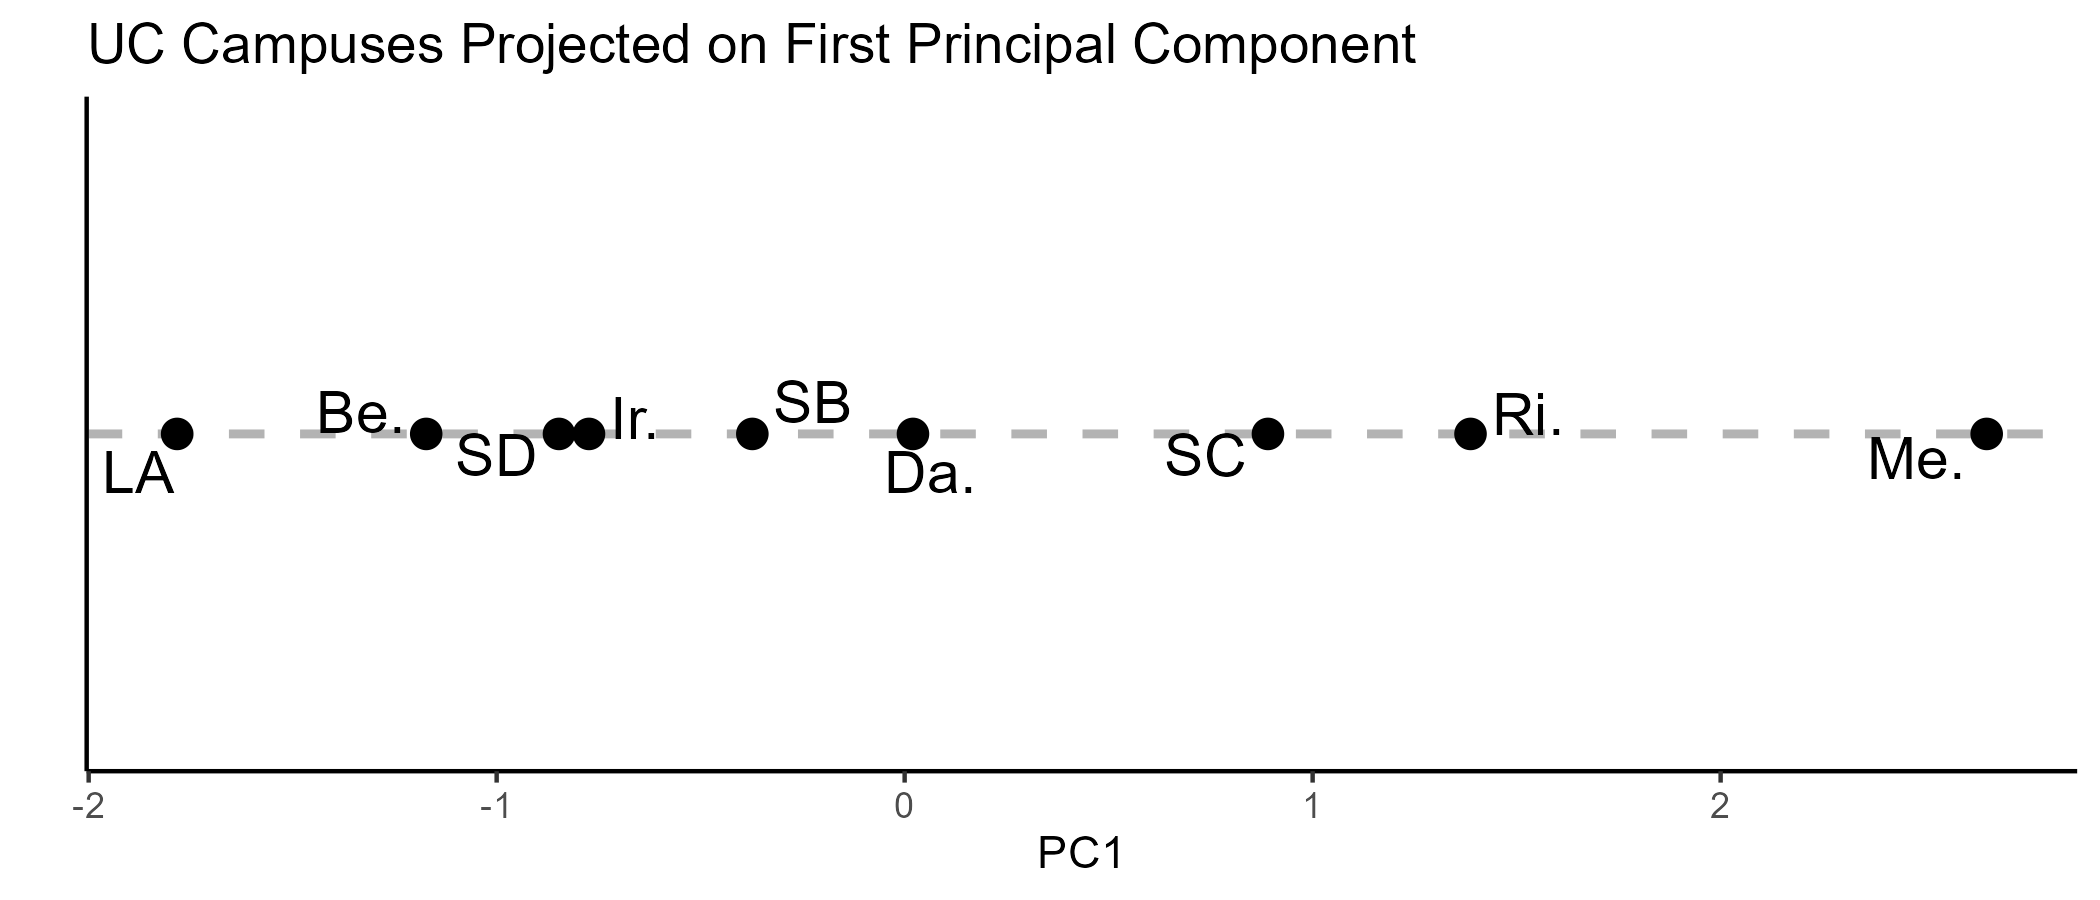
- Use PCA to map the smartphone market
Competition
- Run K-Means to cluster the respondents
- Give a meaningful name to each cluster
- Run PCA so that you can visualize the centroids in two dimensions
- Visualize the cluster centroids in two-dimensional space and use point sizes to indicate cluster sizes, and label the centroids, in order to map the distribution of MGT 100 students’ career ambitions

Recap
- Customer needs best predict customer behavior, not demos
- Market maps depict competition, aid positioning
- K-Means augments a dataset by identifying similarities within it
- PCA compresses high-dim data into low-dim space w minimal information loss
- Embeddings represent words as points in concept-space
- Large language models are trained using RLHF to predict recursive sequences of next-words

Going further
- Book: Applied Causal Inference Powered by ML and AI
- Deep Dive into LLMs like ChatGPT by Karpathy (2025)
- Tracing the thoughts of a large language model
- K-Means Clustering: An Explorable Explainer
- Learning the k in k-means (Hammerly and Elkan 2003)