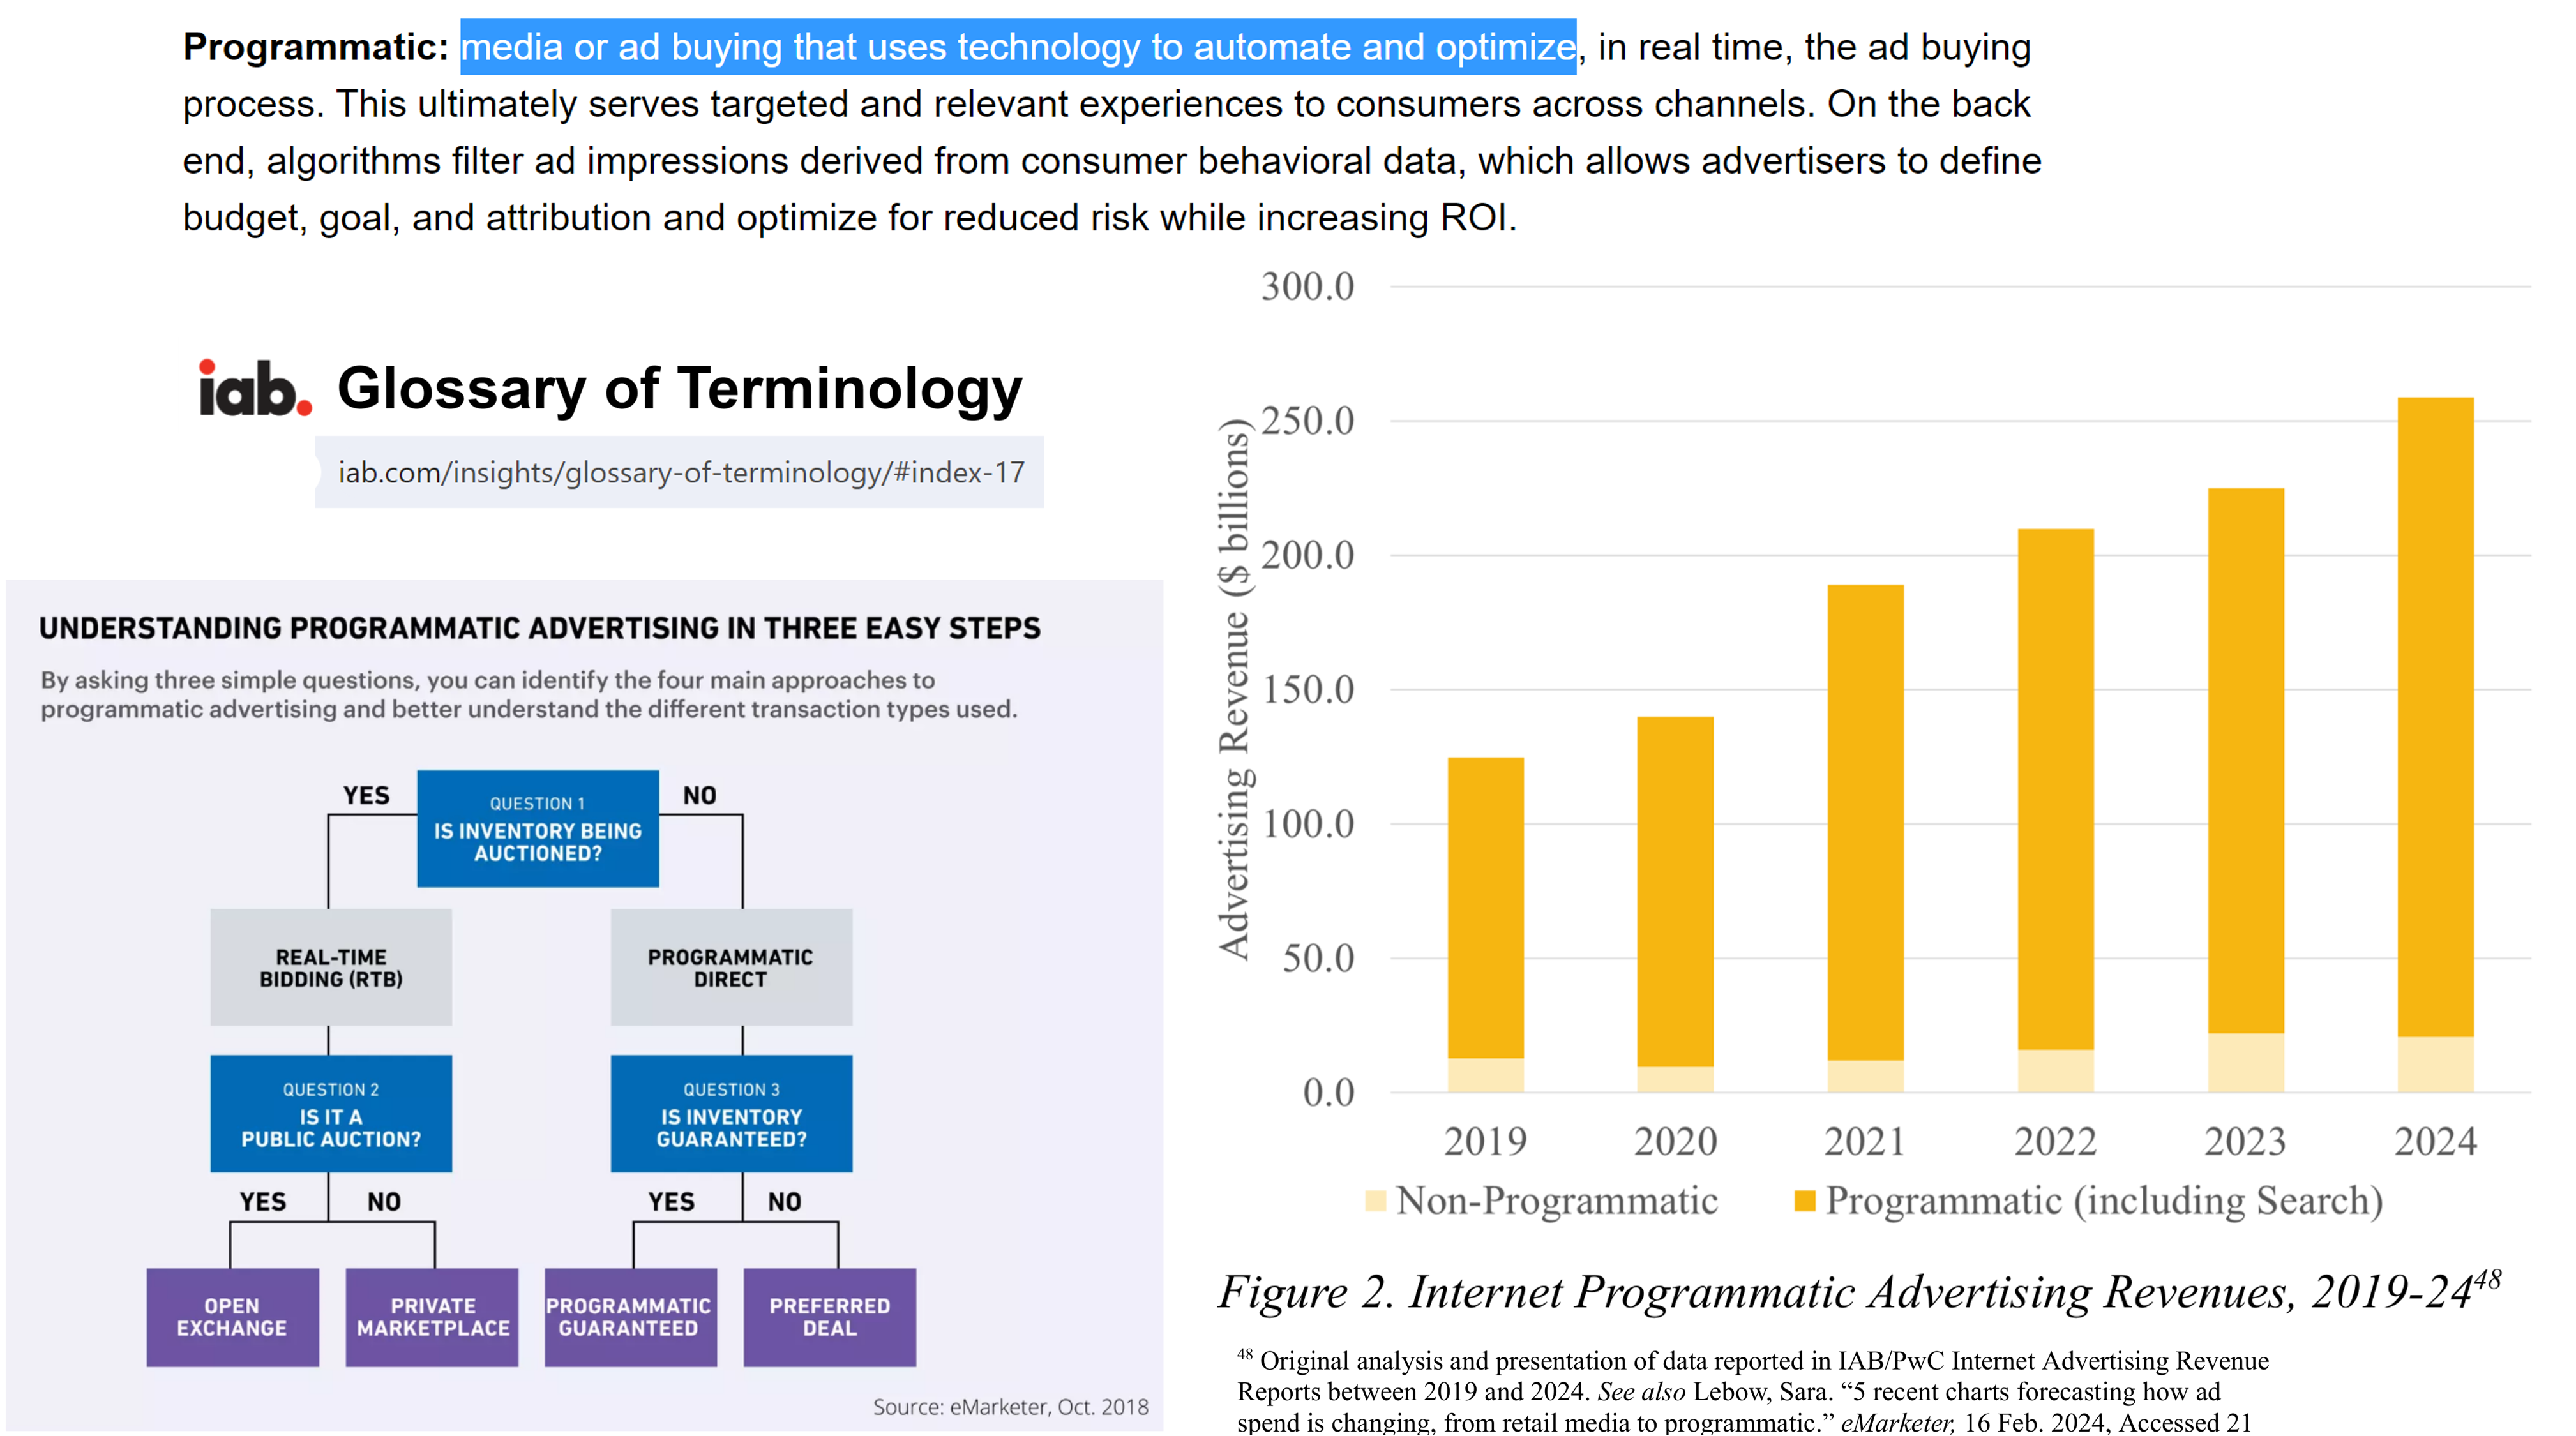
- Retail media networks now
    - provide data for ad targeting
    - sell sponsored product search listings
    - partner with publishers to sell display & video ads
Brand safety: Protect brands against negative impacts on consumer opinion associated with specific types of content [1]
    - E.g., proximate to military conflict, obscenity, drugs, ...
    - Ad verification vendors monitor ad placements
    - Keyword blacklists and whitelists determine contextual ad bids
    - Yet fraudulent ad sales may place brand ads in non-safe contexts
Brand suitability: Help a brand avoid brand-inappropriate content, and identify brand-aligned content [1]
    - Gray areas abound, e.g. cannabis-related content
    - Brand safety may over-reach and defund controversial topics
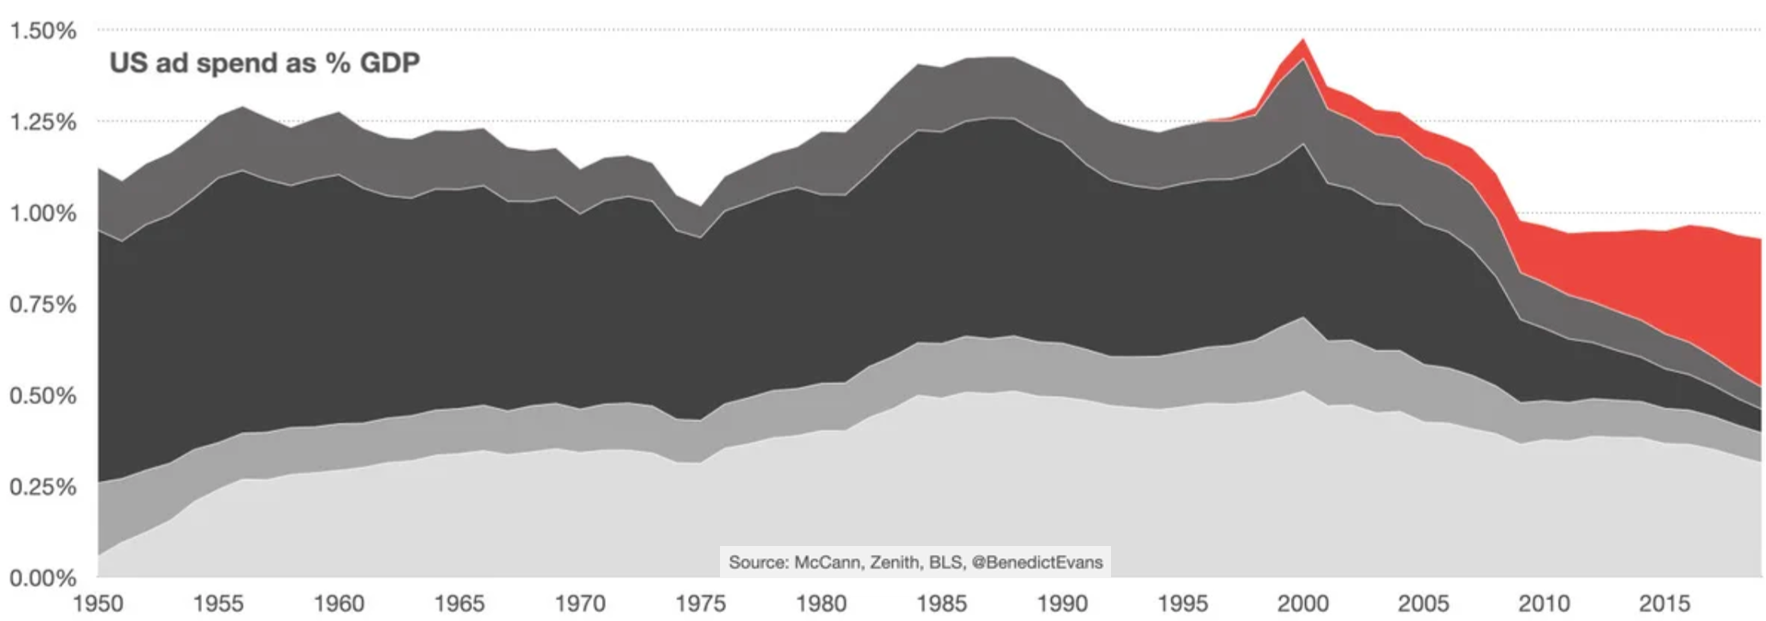
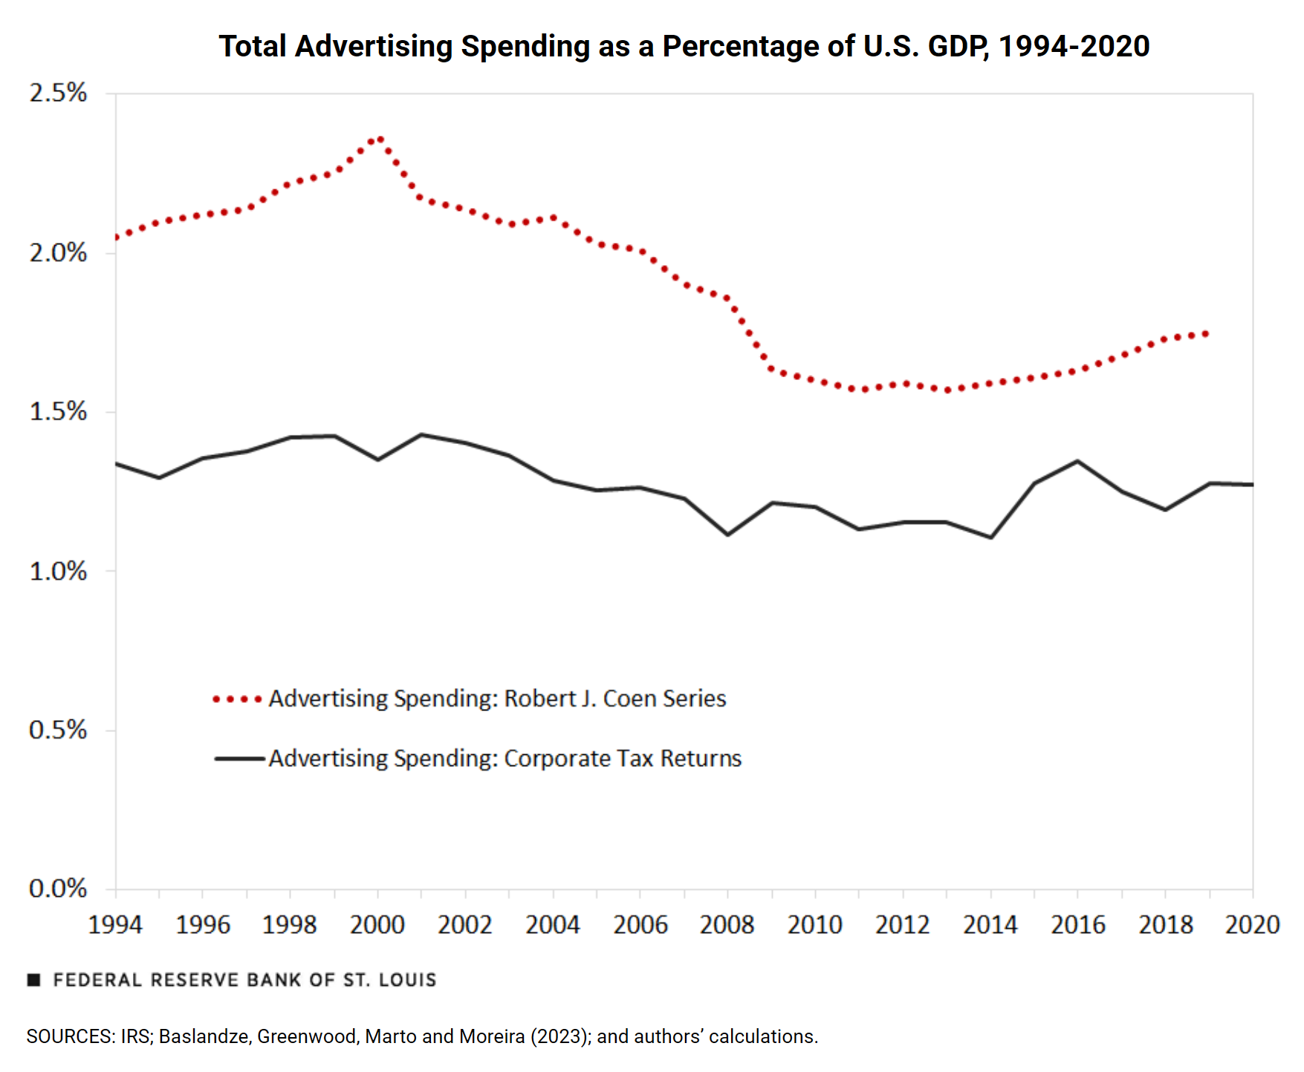
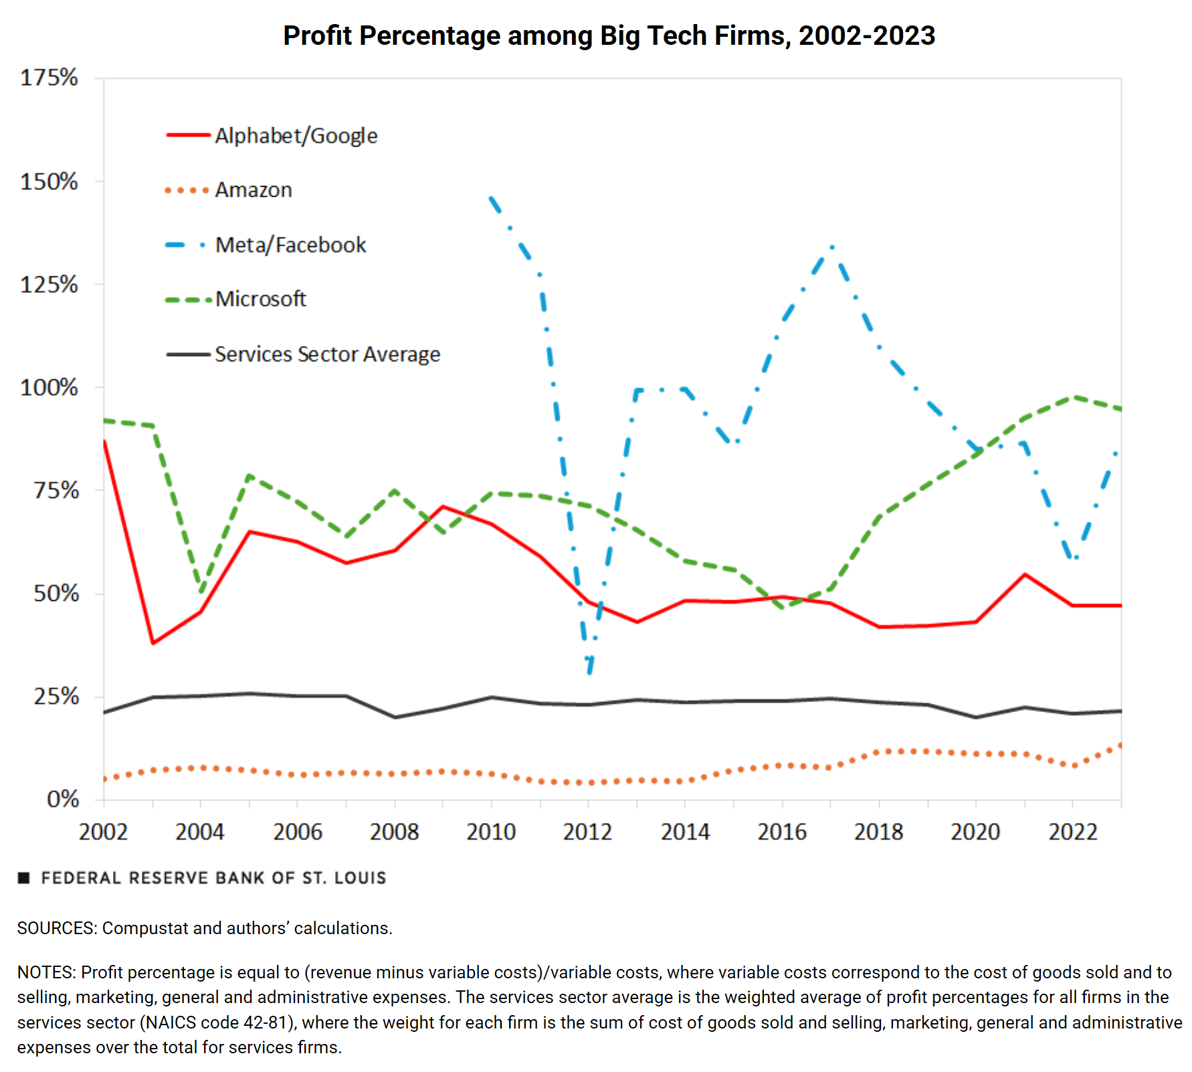
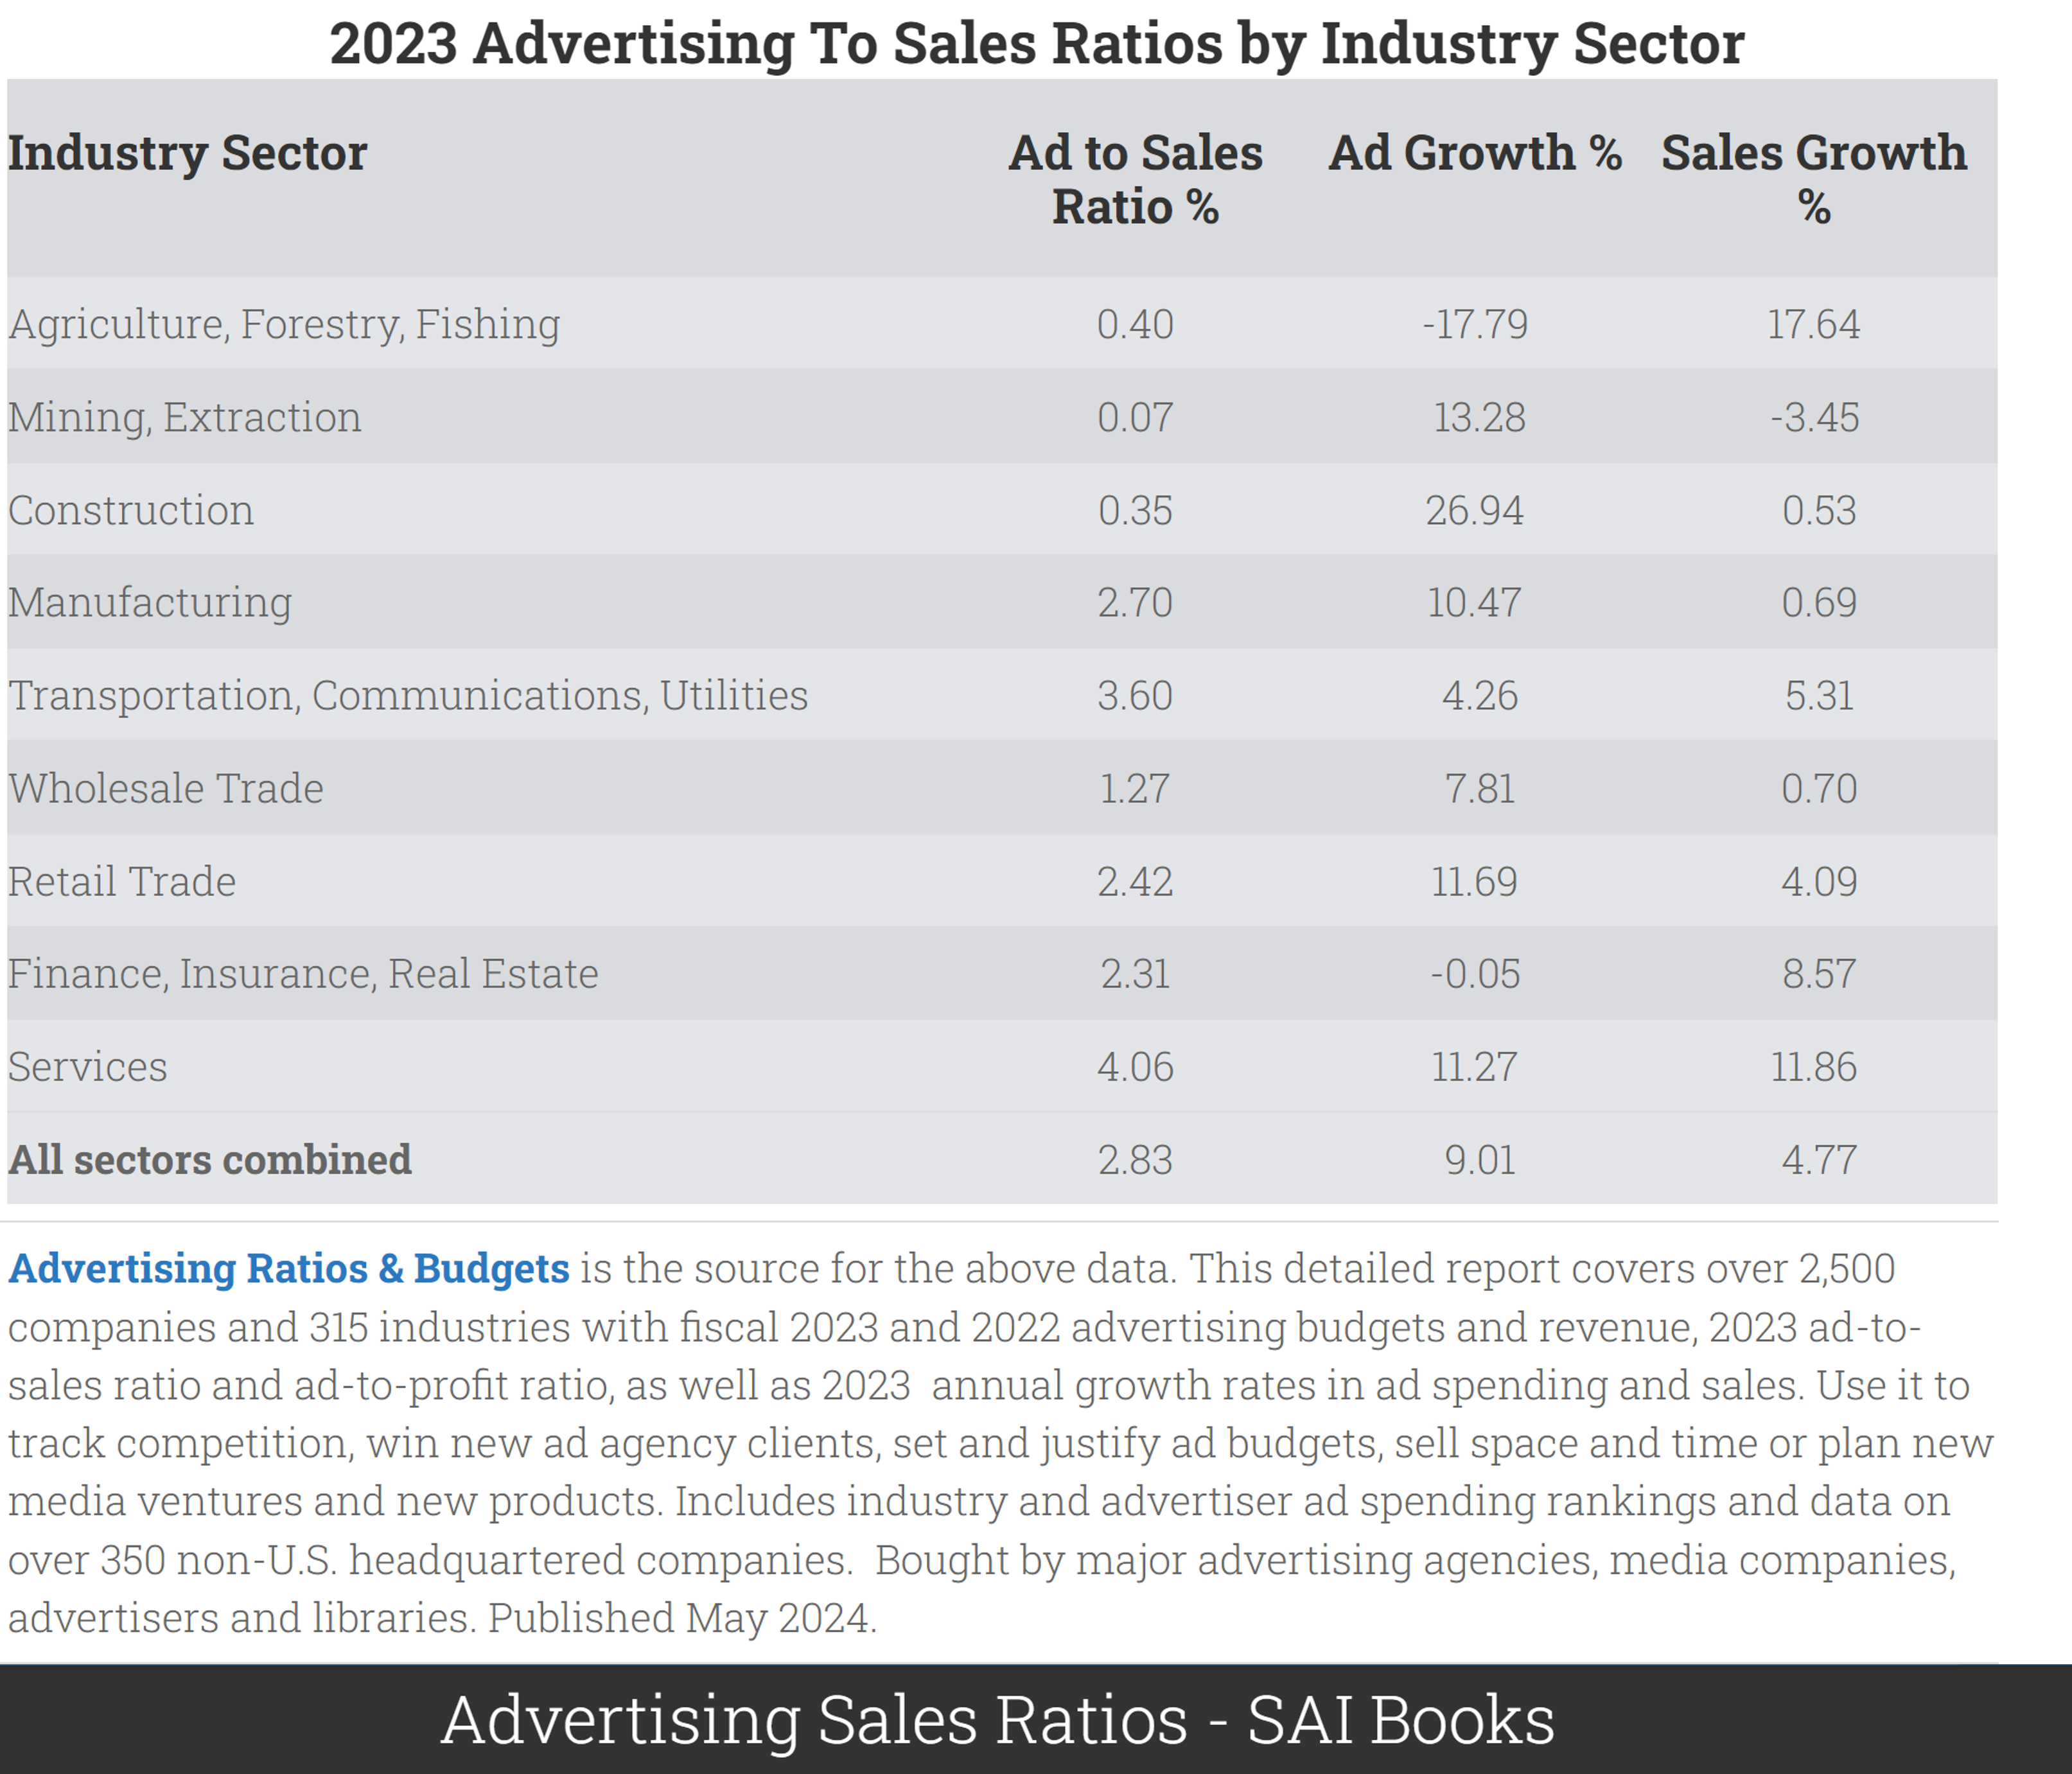
    - Across sectors, typical ad-sales ratio is 2.83\%
    - Typical public company net margin: 8-10%
    - So modal firm could increase EBITDA 28-35% by dropping ads: (8+2.83)/8=1.35
    - Or could it? What would happen to top-line revenue and cost efficiencies?
Toy economics of advertising
Suppose we pay $10 to buy 1,000 digital ad OTS. Suppose 3 people click, 1 person buys.
Ad profit > 0 if transaction margin > $10
- But we bought ads for 999 people who didn't buy
Or, ad profit > 0 if CLV > $10
- Long-term mentality justifies increased ad budget
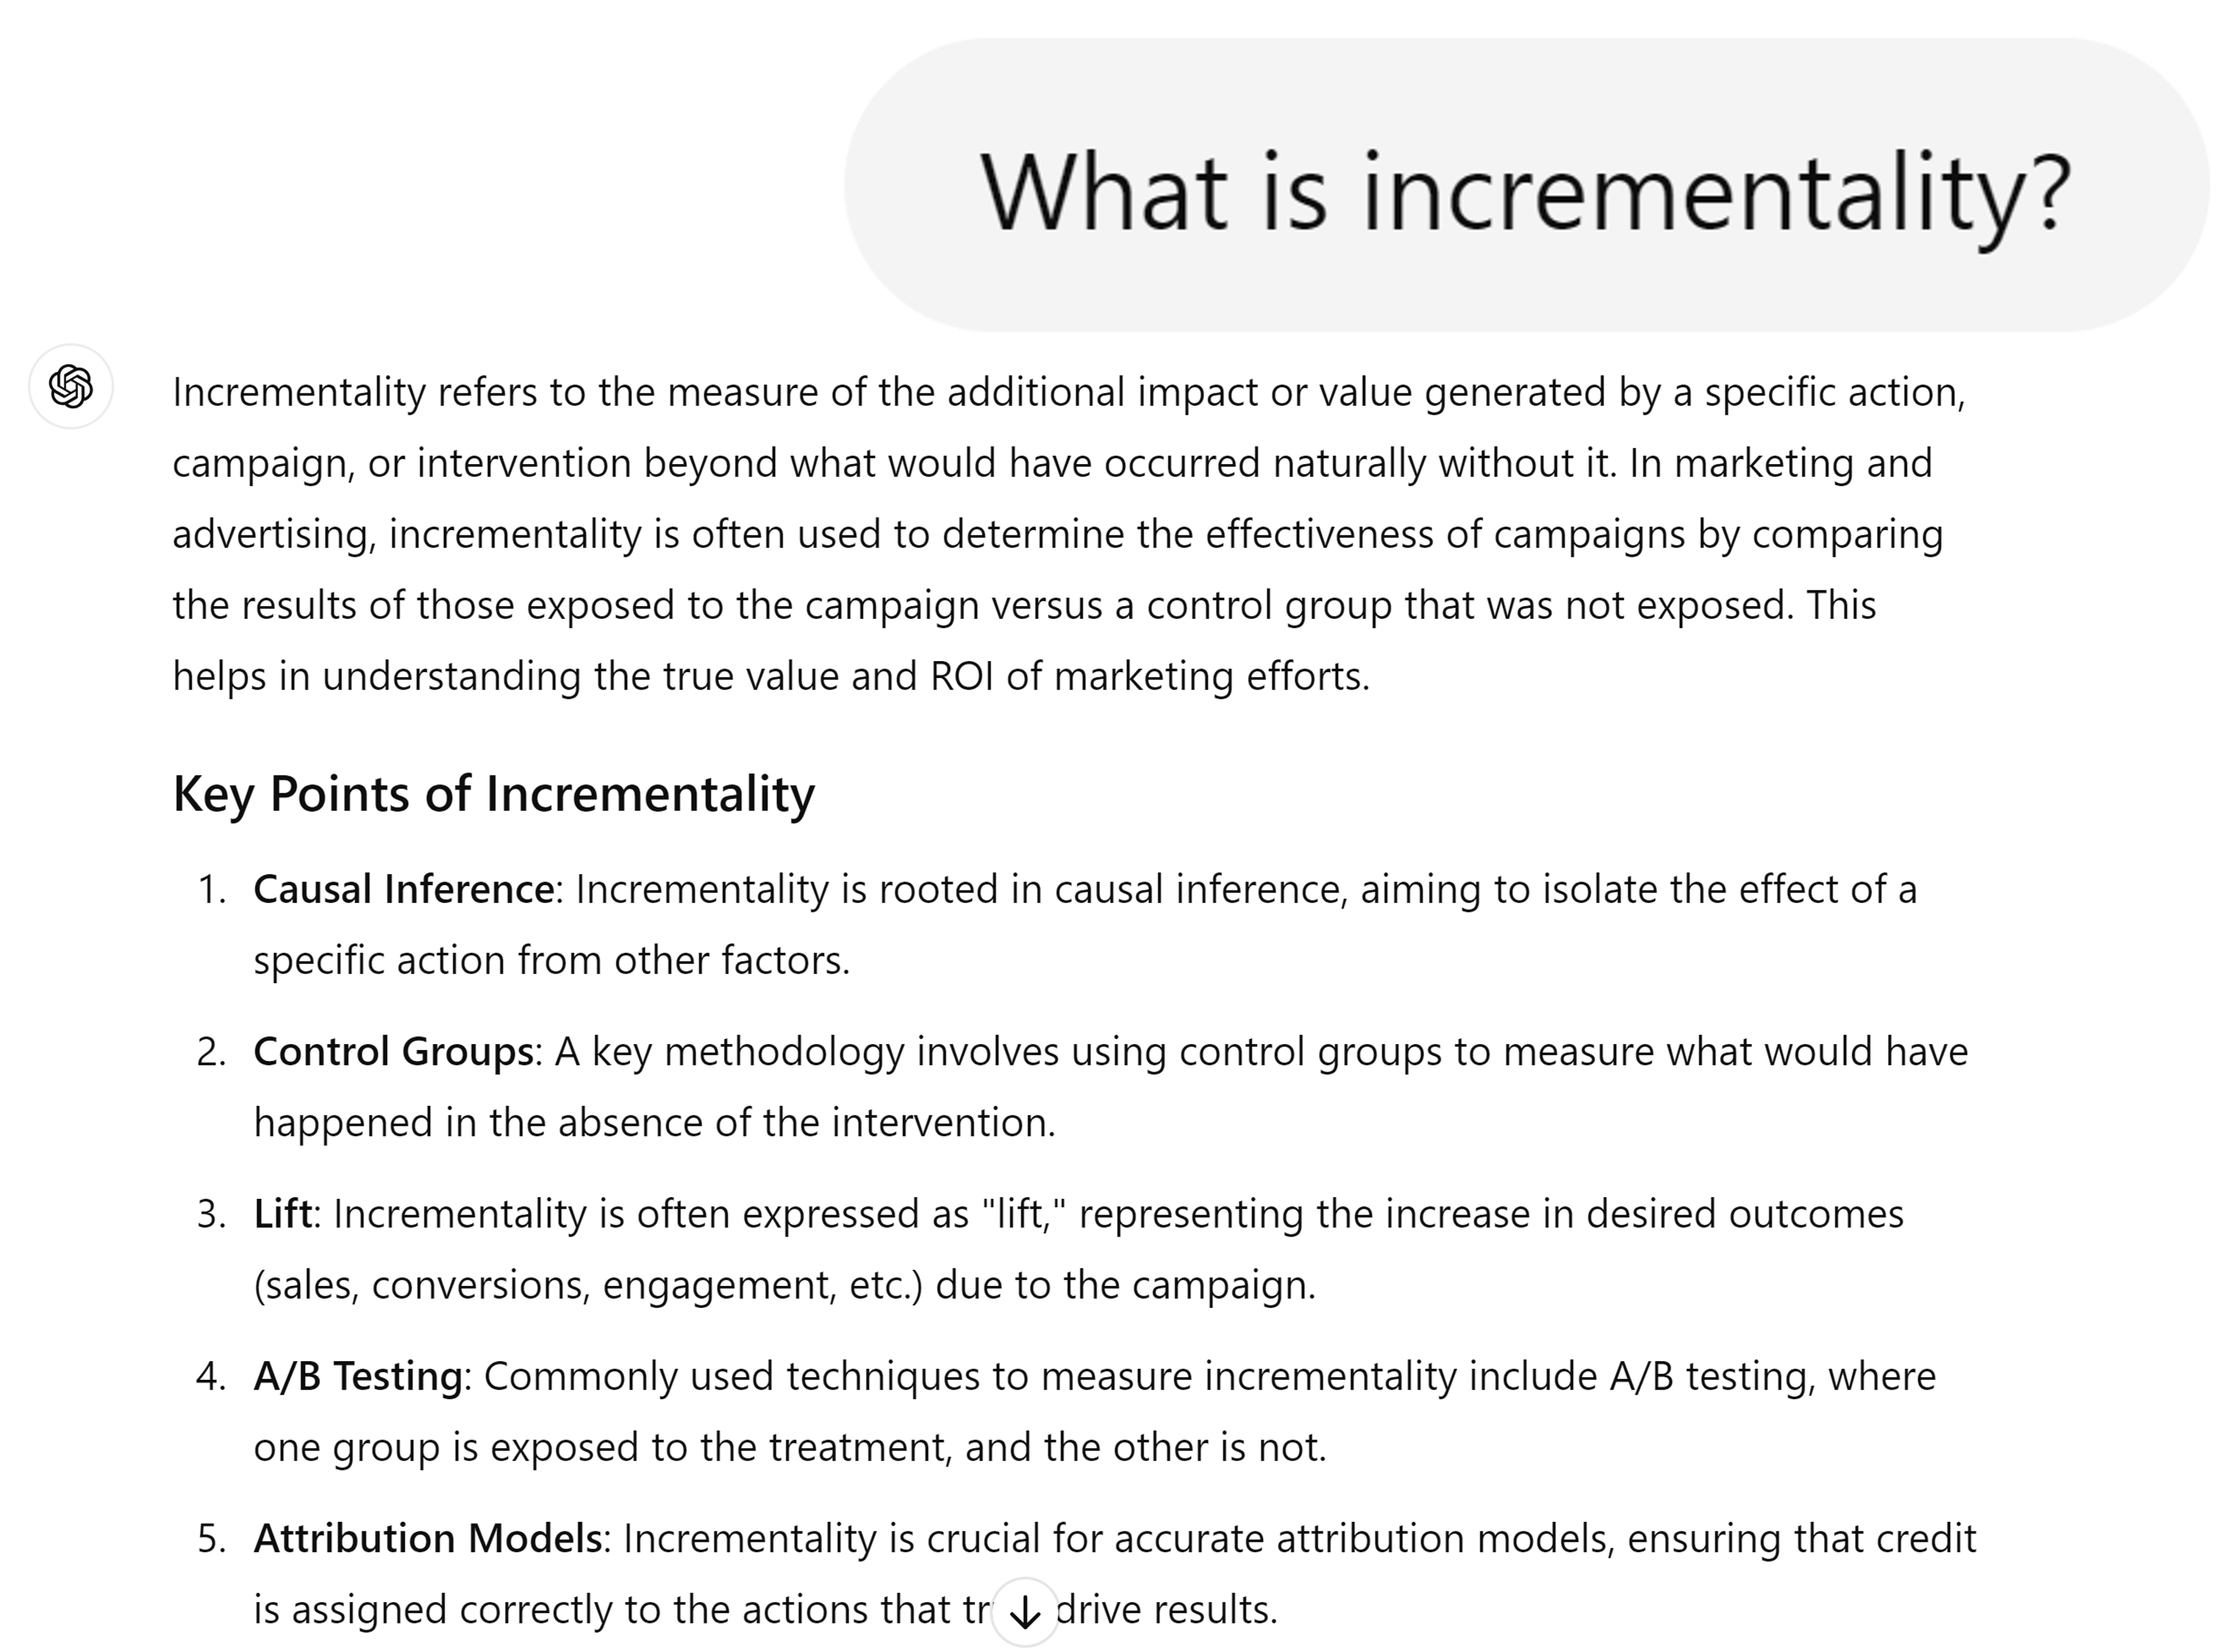
Or, ad profit > 0 if CLV > $10 and if the customer would not have purchased otherwise
    - This is "incrementality"
    - But how would we know if they would have purchased otherwise?
Ad effects are subtle–typically, 99.5-99.9% don’t convert–but ad profit can still be robust
    - Ad profit depends on ad cost, conversion rate, margin ... and how we formulate our objective function
    - Exception: Search ads are atypical, you may see conversion rates like 1-5%, but incrementality questions are even more important
- Outcomes might include visits, sales, reviews, ...
- Predictors might include ads, customer attributes & behaviors, device/session attributes, ...
- You calculate 10k bivariate correlation coefficients
Suppose everything is noise, no true relationships
- The distribution of the 10,000 correlation coefficients would be Normal, tightly centered around zero
- A 2-sided test of {corr == 0} would reject at 95% if |r|>.0062
We should expect 500 false positives - What is a ‘false positive’ exactly?
In general, what can we learn from a significant correlation?
- "These two variables likely move together." Anything more requires assumptions.
Classic misleading correlations
“Lucky socks” and sports wins
- Post hoc fallacy [1] (precedence indicates causality AKA superstition)
Commuters carrying umbrellas and rain
- Forward-looking behavior
Kids receiving tutoring and grades
- Reverse causality / selection bias
Ice cream sales and drowning deaths
- Unobserved confounds
Correlations are measurable & usually predictive, but hard to interpret causally
    - Correlation-based beliefs are hard to disprove and therefore sticky
    - Correlations that reinforce logical theories are especially sticky
    - Correlation-based beliefs may or may not reflect causal relationships
“Revenue too high alert”
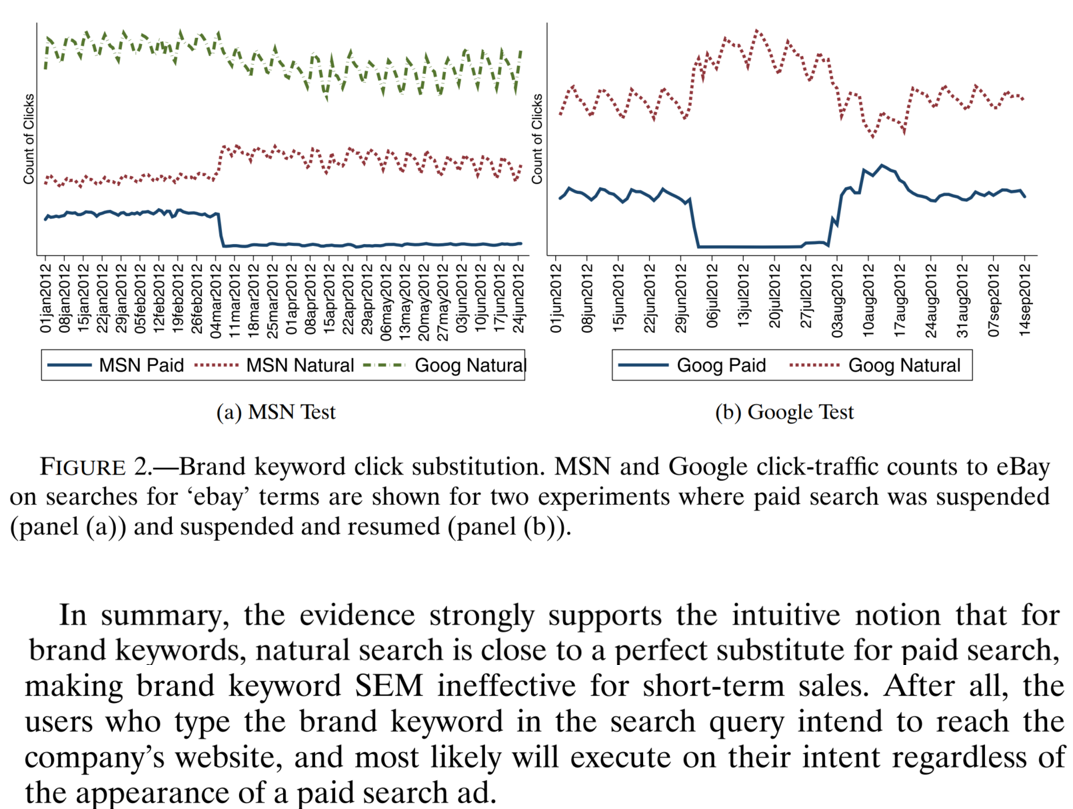
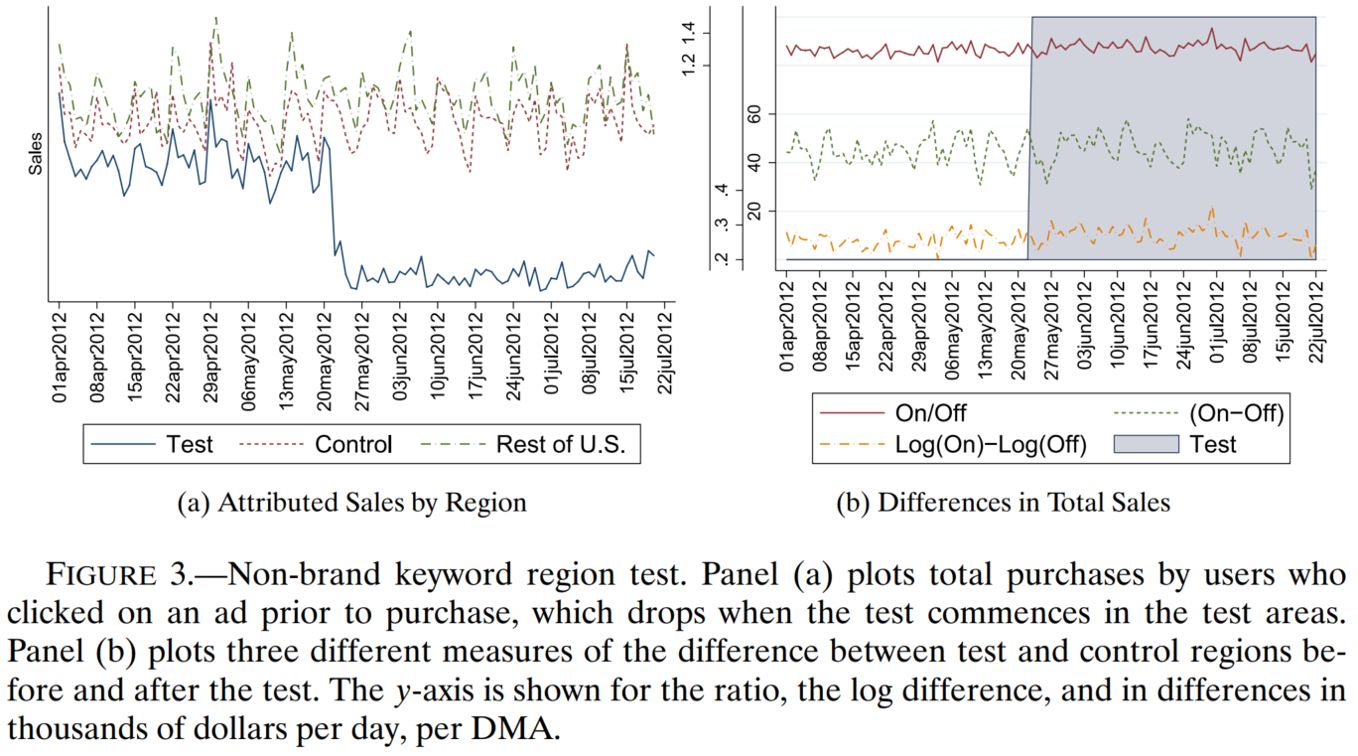
In 2015 economists working at eBay reported a series of geo experiments testing how shutting off paid search ads affected search clicks, sales and attributed sales
- Attributed sales fell, but actual sales didn't. Hmmm
- These results led to changes in eBay's ad measurement
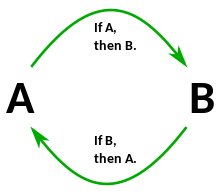
Fundamental Problem of Causal Inference
Causal Inference
Suppose we have a binary “treatment” or “policy” variable \(T_i\) that we can “assign” to person \(i\)
- Examples: Advertise, Serve a design, Recommend a product
Suppose person \(i\) could have a binary potential “response” or “outcome” variable \(Y_i(T_i)\)
- Examples: Visit site, Click product, Add to Cart, Purchase, Rate, Review
- Looks like the marketing funnel model we saw previously
- "Treatment" terminology came from medical literature; Y could be patient outcome
Important: \(Y_i\) may depend fully, partially, or not at all on \(T_i\), and the relationship may differ across people
- Person 1 may buy due to an ad; person 2 may stop due to an ad
Why care?
We want to maximize profits \(\Pi = \Sigma_i \pi_i(Y_i(T_i), T_i)\)
Suppose \(Y_i=1\) contributes to revenue; then \(\frac{\partial \pi_i}{\partial Y_i} >0\)
Suppose \(T_i=1\) has a known cost, so \(\frac{\partial \pi_i}{\partial T_i} <0\)
Effect of \(T_i=1\) on \(\pi_i\) is \(\frac{d\pi_i}{dT_i}=\frac{\partial \pi_i}{\partial Y_i}\frac{\partial Y_i}{\partial T_i}+\frac{\partial \pi_i}{\partial T_i}\)
We have to know \(\frac{\partial Y_i}{\partial T_i}\) to optimize \(T_i\) assignments
- Called the "treatment effect" (TE)
Profits may decrease if we misallocate \(T_i\)
Fundamental Problem of Causal Inference
We can only observe either\(Y_i(T_i=1)\)or\(Y_i(T_i=0)\), but not both, for each person \(i\)
- The case we don't observe is called the "counterfactual"
This is a missing-data problem that we cannot resolve. We only have one reality
- A major reason we build models is to compensate for missing data
So what can we do?
Experiment. Randomize \(T_i\) and estimate \(\frac{\partial Y_i}{\partial T_i}\) as avg \(Y_i(T_i=1)-Y_i(T_i=0)\)
 - Called the "Average Treatment Effect"
 - Creates new data; costs time, money, effort; deceptively difficult to design and then act on
Use assumptions & data to estimate a “quasi-experimental” average treatment effect using archival data
- Requires expertise, time, effort; difficult to validate; not always possible
Use correlations: Assume past treatments were assigned randomly, use past data to estimate \(\frac{\partial Y_i}{\partial T_i}\)
 - Much easier than 1 or 2
 - But T is only randomly assigned when we run an experiment, so what exactly are we doing here?
 - Are we paying our agencies to distribute our ads randomly?
Fuhgeddaboutit, go with the vibes, do what we feel
- Lots of advertisers do this
How much does causality matter?
- How hard should we work?
Are organizational incentives aligned with profits?
Data thickness: How likely can we get a good estimate?
Organizational analytics culture: Will we act on what we learn?
Individual: promotion, bonus, reputation, career Will credit be stolen or blame be shared?
Accountability: Will ex-post attributions verify findings? Will results threaten or complement rival teams/execs?
- Analytics culture starts at the top
Advertising measurement
Measurement of what?
- Paid media distinct from owned media & earned media
Measurement on what?
      - Performance advertising: Campaigns designed to stimulate short-run measurable response. Could be any funnel stage, including awareness, information, consideration, price knowledge, visitation and sales. We should measure all funnel effects

      - Brand advertising: Campaigns designed to stimulate long-run response. Measurable in multiple ways, but measurement will usually be incomplete
Advertising measurement quantifies ad delivery, exposure and outcomes to improve advertising efforts
Advertising measurement is hard because ad effects depend on ad content, context, timing, targeting, current market conditions, past advertising & past outcomes ; all of which change
- Shooting at a moving target
Advertising measurement is expensive, so must directly inform firm choices
- We have to know how measurements will inform next steps, else measurement is wasting money
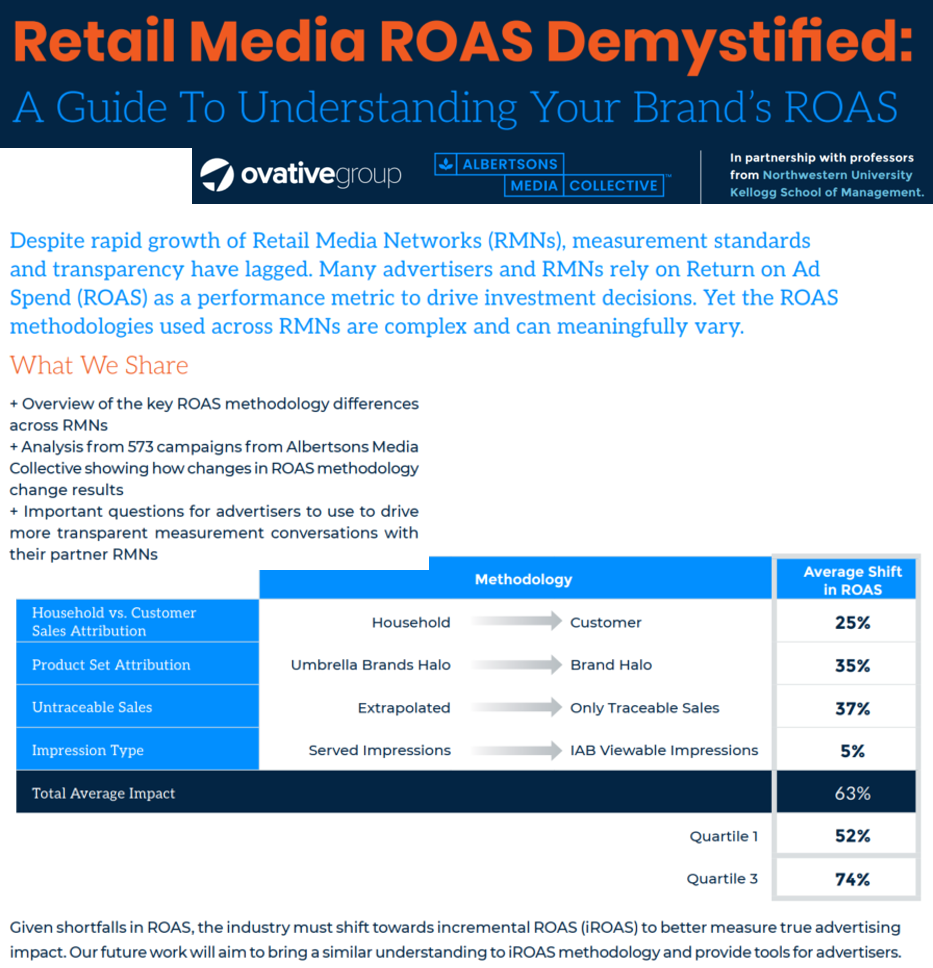
What do we measure?
Most often, we measure Return on Advertising Spend (ROAS)
\(\frac{\text{Revenue Attributed to Ads}}{\text{Ad Spending}}\) or \(\frac{\text{Revenue Attributed to Ads}-\text{Ad Spending}}{\text{Ad Spending}}\)
Increasingly, we report incremental ROAS (iROAS) if we have causal identification
- ROAS != iROAS bc attribution is usually correlational
We also should measure delivery and funnel-wide KPIs, e.g. brand metrics, visits, add-to-cart, sales, revenue, …
- We usually get economies of scope in measurement
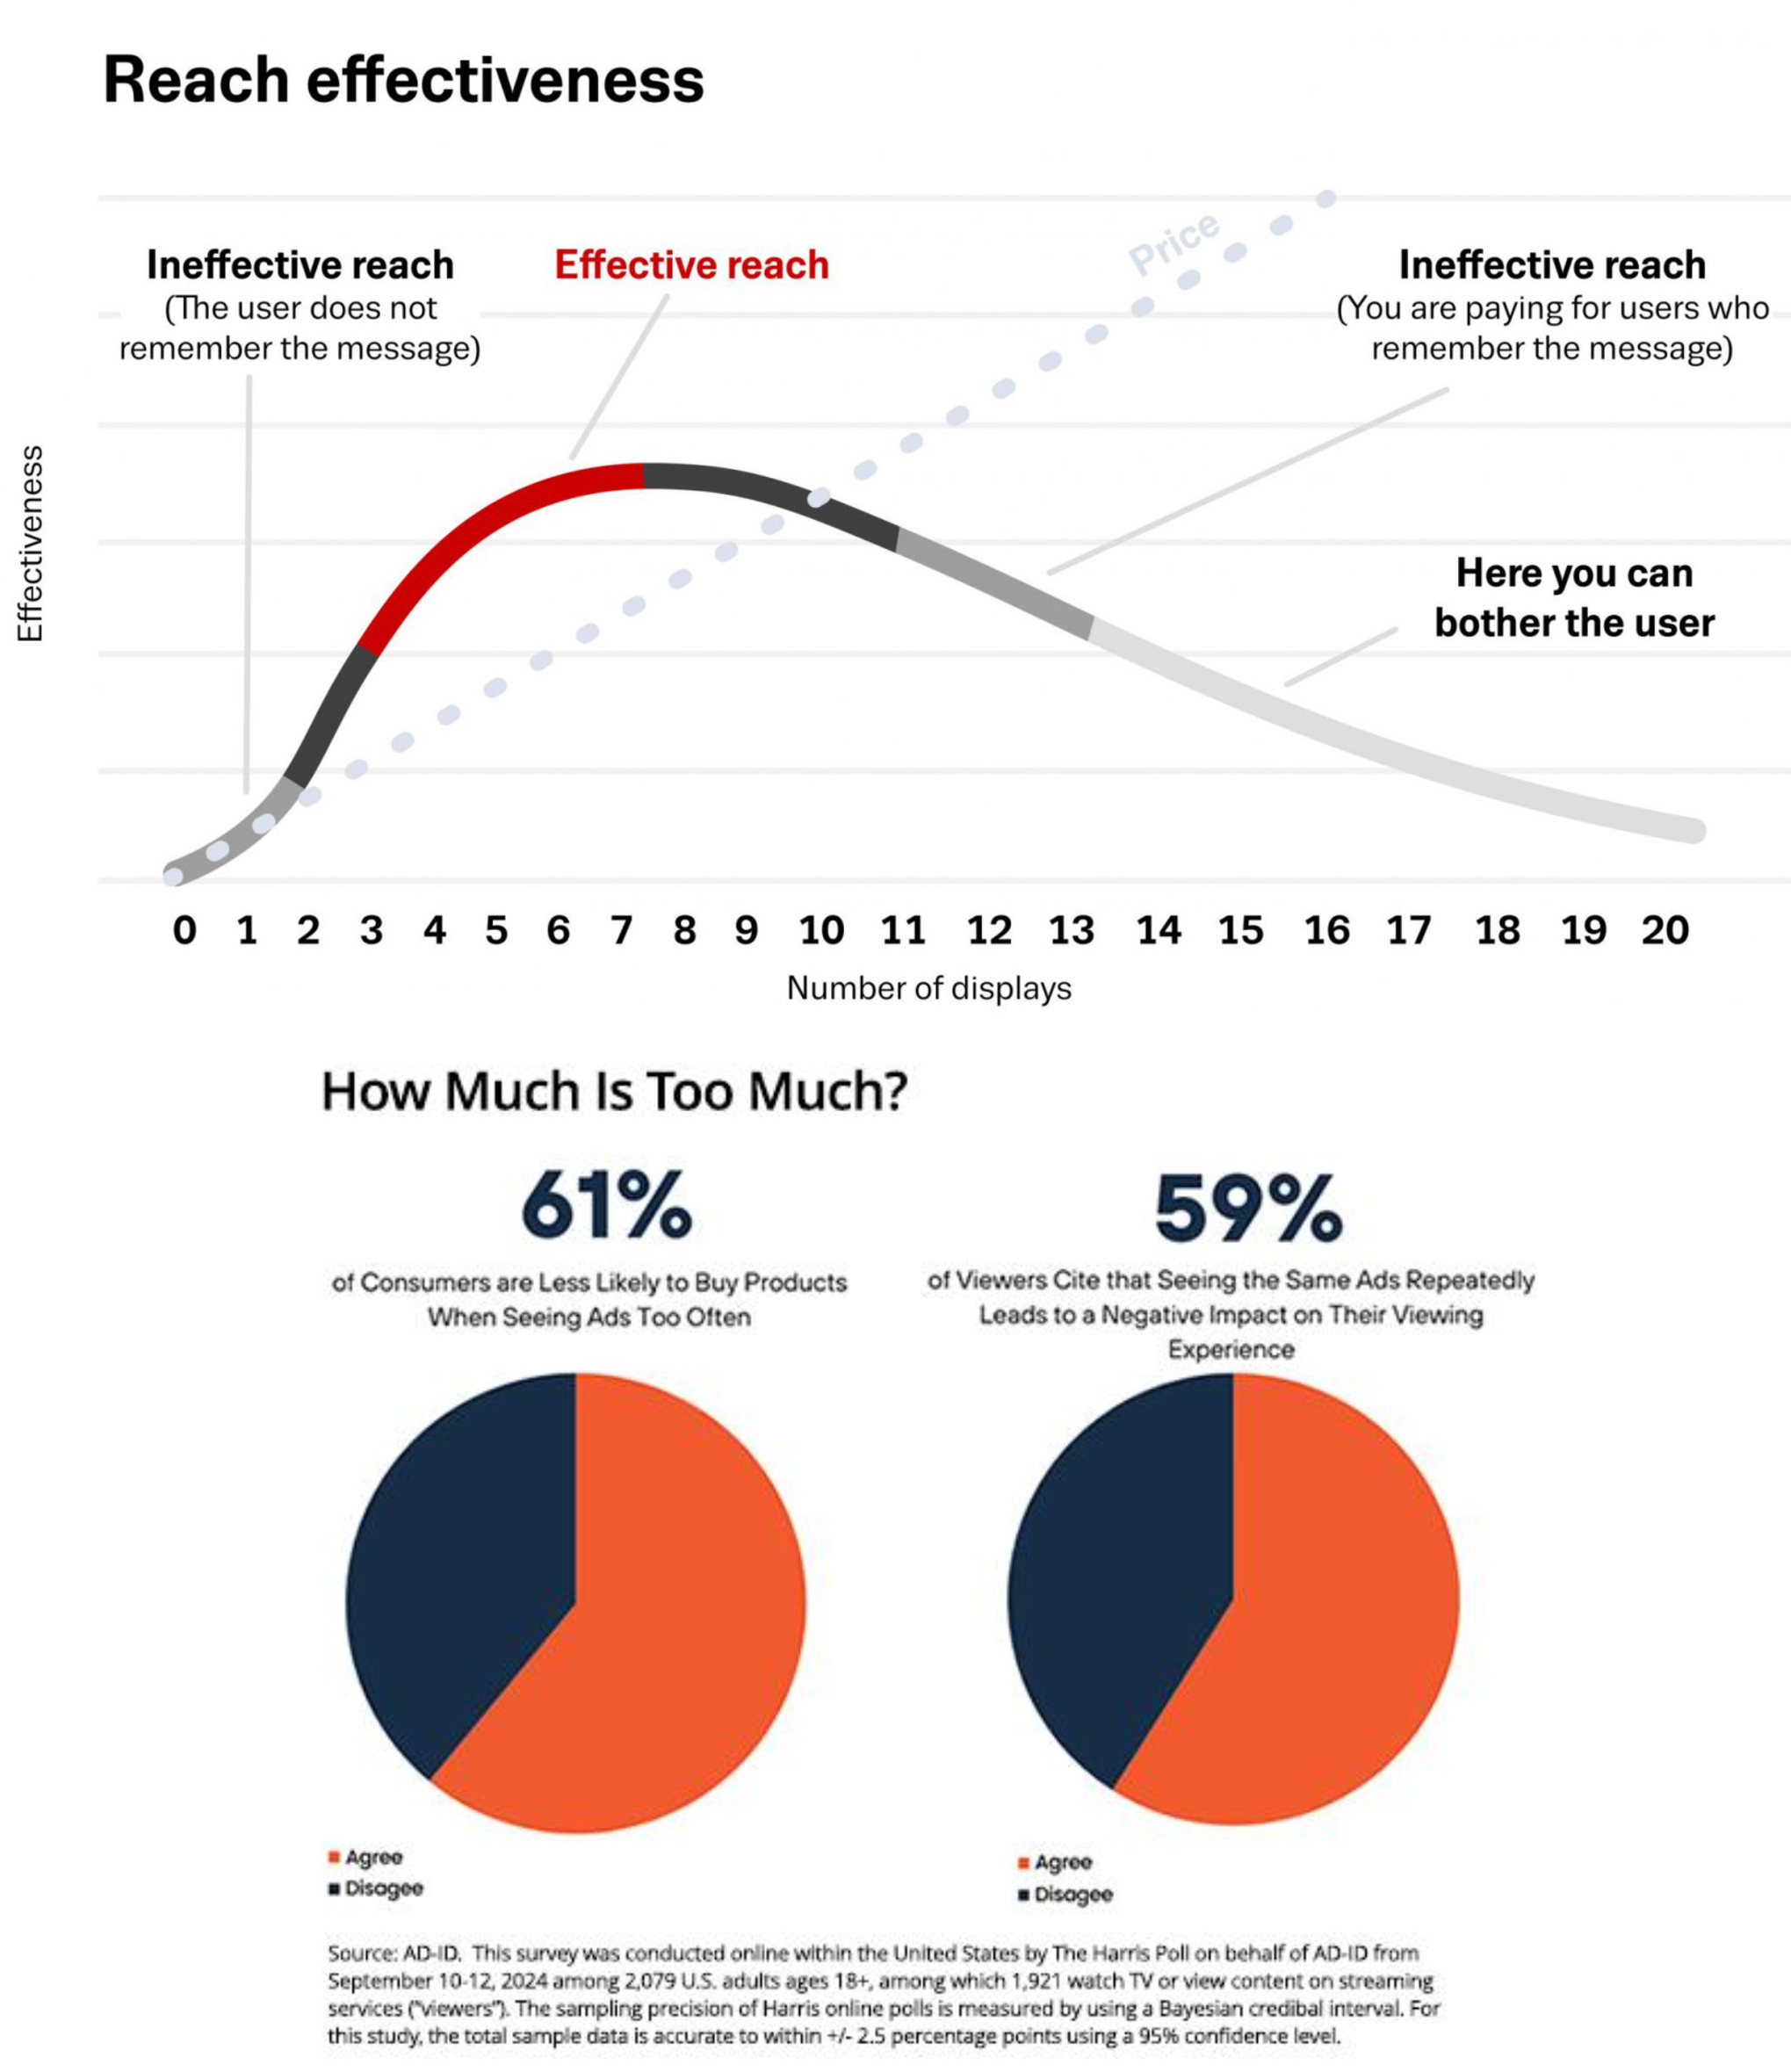
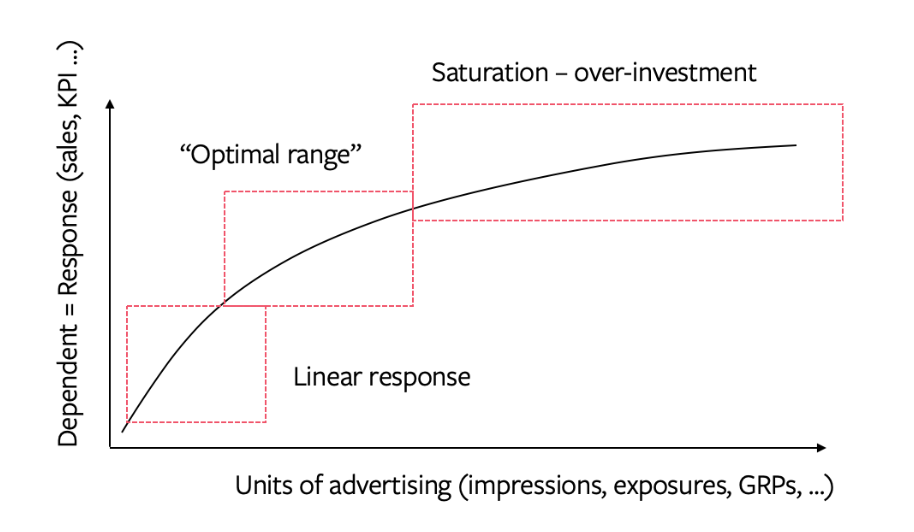
Diminishing returns
      In theory, we buy the best ad opportunities first
      So, increasing spend should lower marginal returns ("saturation")
      Marginal ROAS (mROAS) is the tangent to the curve
      Nonlinearity means that ROAS != mROAS
      We use ROAS for overall evaluation, and mROAS for budget reallocation
      We don't necessarily want to maximize ROAS or mROAS (why not?)
      The curve above can be S-shaped, but it's hard to prove empirically
Correlational advertising measurement
1. Lift Statistics
Compare conversion rates between people exposed to ads and people not exposed to ads
Usually reported as \(\frac{Prob.\{Conversion|Ad\}}{Prob.\{Conversion|NoAd\}}\) or \(\frac{Prob.\{Conversion|Ad\}-Prob.\{Conversion|NoAd\}}{Prob.\{Conversion|NoAd\}}\)
Lift > 1 interpreted as ads are working
    This is purely correlational, as it ignores all targeting efforts

    Lift can be incremental if ads are allocated randomly
2. Regression
Get historical data on \(Y_i\) and \(T_i\) and run a regression
       Could be across individuals, places, time, or combinations
       Most people use OLS or MMM, but Google's CausalImpact R package is also popular
The implicit assumption is that past ads were allocated randomly, i.e. correlation\(==\)causality
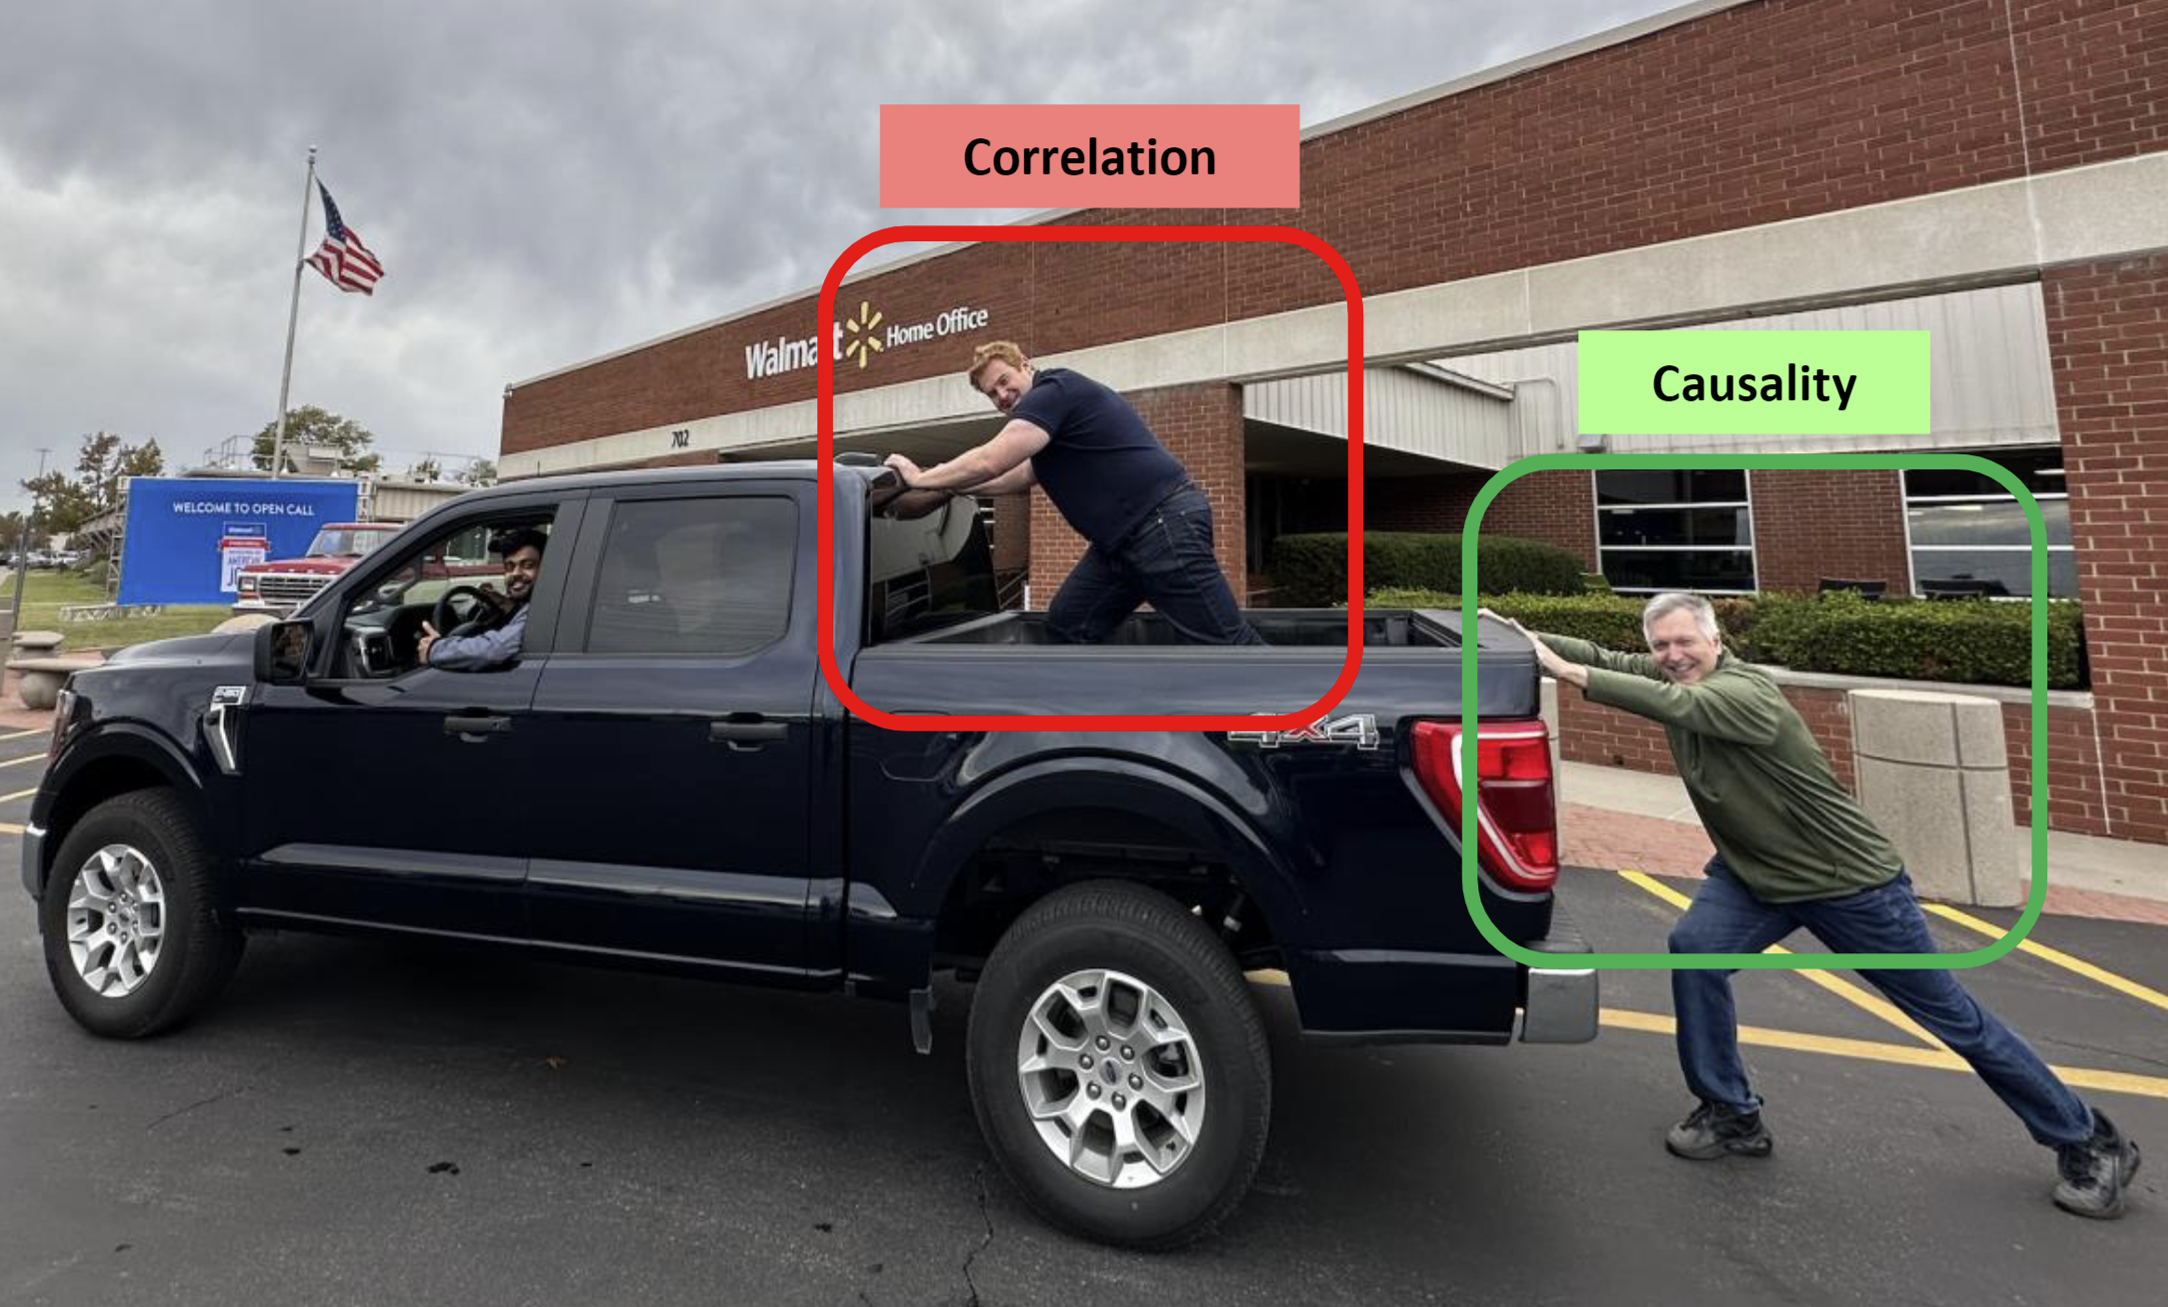
      "Better to be vaguely right than precisely wrong"
      But are we the guy in the truck bed?
In truth, past ads were only random if we ran an experiment
3. Multi-Touch Attribution (MTA)
Get individual-level data on every touchpoint for every purchaser
      - Includes earned media (PR, reviews, organic social), owned media (website, content marketing, email) & paid media (<--ads; also, paid influencer & affiliate)
      - Often sourced from third parties
Choose a rule to attribute purchases to touchpoints
      - Single-touch rules: Last-touch, first-touch
      - Multi-touch rules: Fractional credit, Shapley
      Historically, Last-touch was popular
MTA algorithm searches for touchpoint parameters that best-fit the conversion data given the rule
      - Credit then informs future budget allocations
      - MTA is designed to maximize attributions
      - MTA assumes advertising is the *sole* driver of conversions
MTA is mostly dead due to privacy and platform reporting changes
      - Governments, platforms, browsers, OS have all restricted MTA input data for privacy
      - Some advertisers' MTA lives on due to inertia, despite signal loss
      - Large platforms offer MTA results within the platform
Strongest args for corr(ad,sales)
Corr(ad,sales) should contain signal
- If ads cause sales, then corr(ad,sales)>0 (probably) (we assume)
Some products/channels just don’t sell without ads
      - E.g., Direct response TV ads for 1-800 phone numbers
      - Career professionals say advertised phone #s get 0 calls without TV ads, so we know the counterfactual
      - Then they get 1-5 calls per 1k viewers, lasting up to ~30 minutes
      - What are some digital analogues to this?
However, this argument gets pushed too far
      - For example, when search advertisers disregard organic link clicks when calculating search ad click profits
      - Notice the converse: corr(ad,sales)>0 does not imply a causal effect of ads on sales
Problem 1 with corr(ad,sales)
Advertisers try to optimize ad campaign decisions
E.g. surfboards in coastal cities, not landlocked cities
If ad optimization increases ad response, then corr(ad,sales) will confound actual ad effect with ad optimization effect
        More ads in san diego, more surfboard sales in san diego. But would we have 0 sales in SD without ads?

        Corr(ad,sales) usually overestimates the causal effect, encourages overadvertising
Many, many firms basically do this
It's ironic when firms that don't run experiments implicitly assume that past ads were randomized
Problem 2 with corr(ad,sales)
How do most advertisers set ad budgets? Historically, the top 2 ways were:
Percentage of sales method, e.g. 3% or 6%
- That's why ads:sales ratios are so often measured, for benchmarking
Competitive parity
…others…
Do you see the problem here?
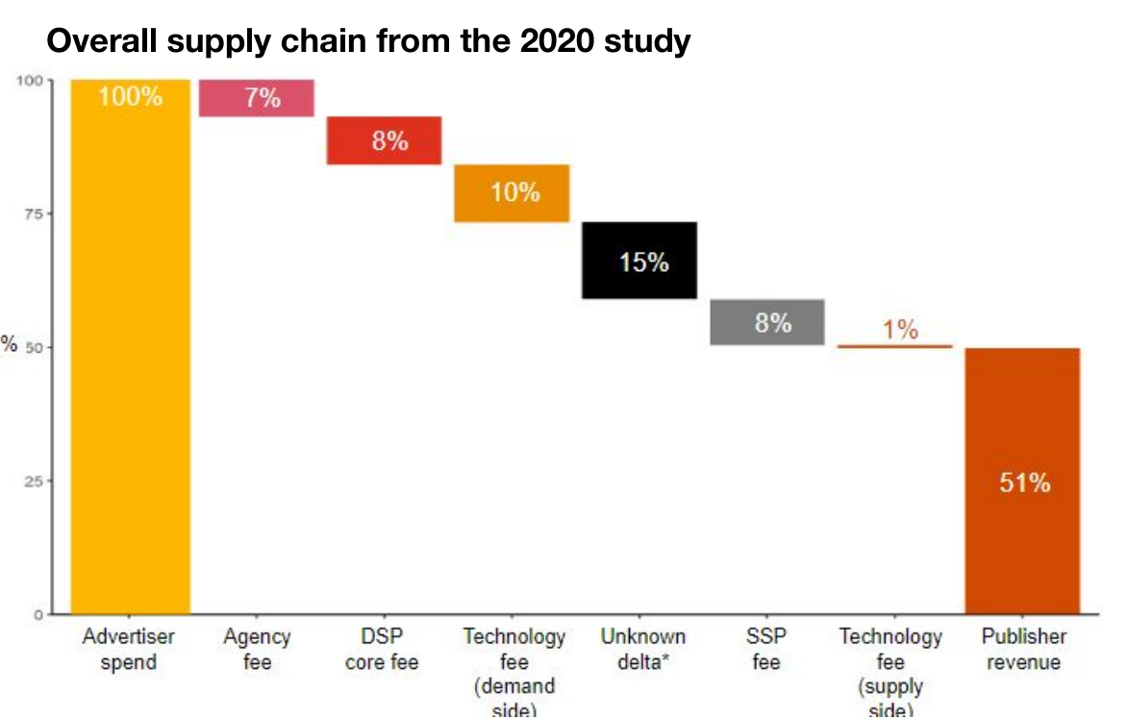
Problem 3 with corr(ad,sales)
Leaves marketers powerless vs big colossal ad platforms
Platforms withhold data and obfuscate algorithms
    - How many ad placements are incremental?
    - How many ad placements target likely converters?
    - How can advertisers react to adversarial ad pricing?
    - How can advertisers evaluate brand safety, targeting, context?
Have ad platforms ever left ad budget unspent?
    - Would you, if you were them?
    - If not, why not? What does that imply about incrementality?
To balance platform power, you have to know your ad profits & vote with your feet
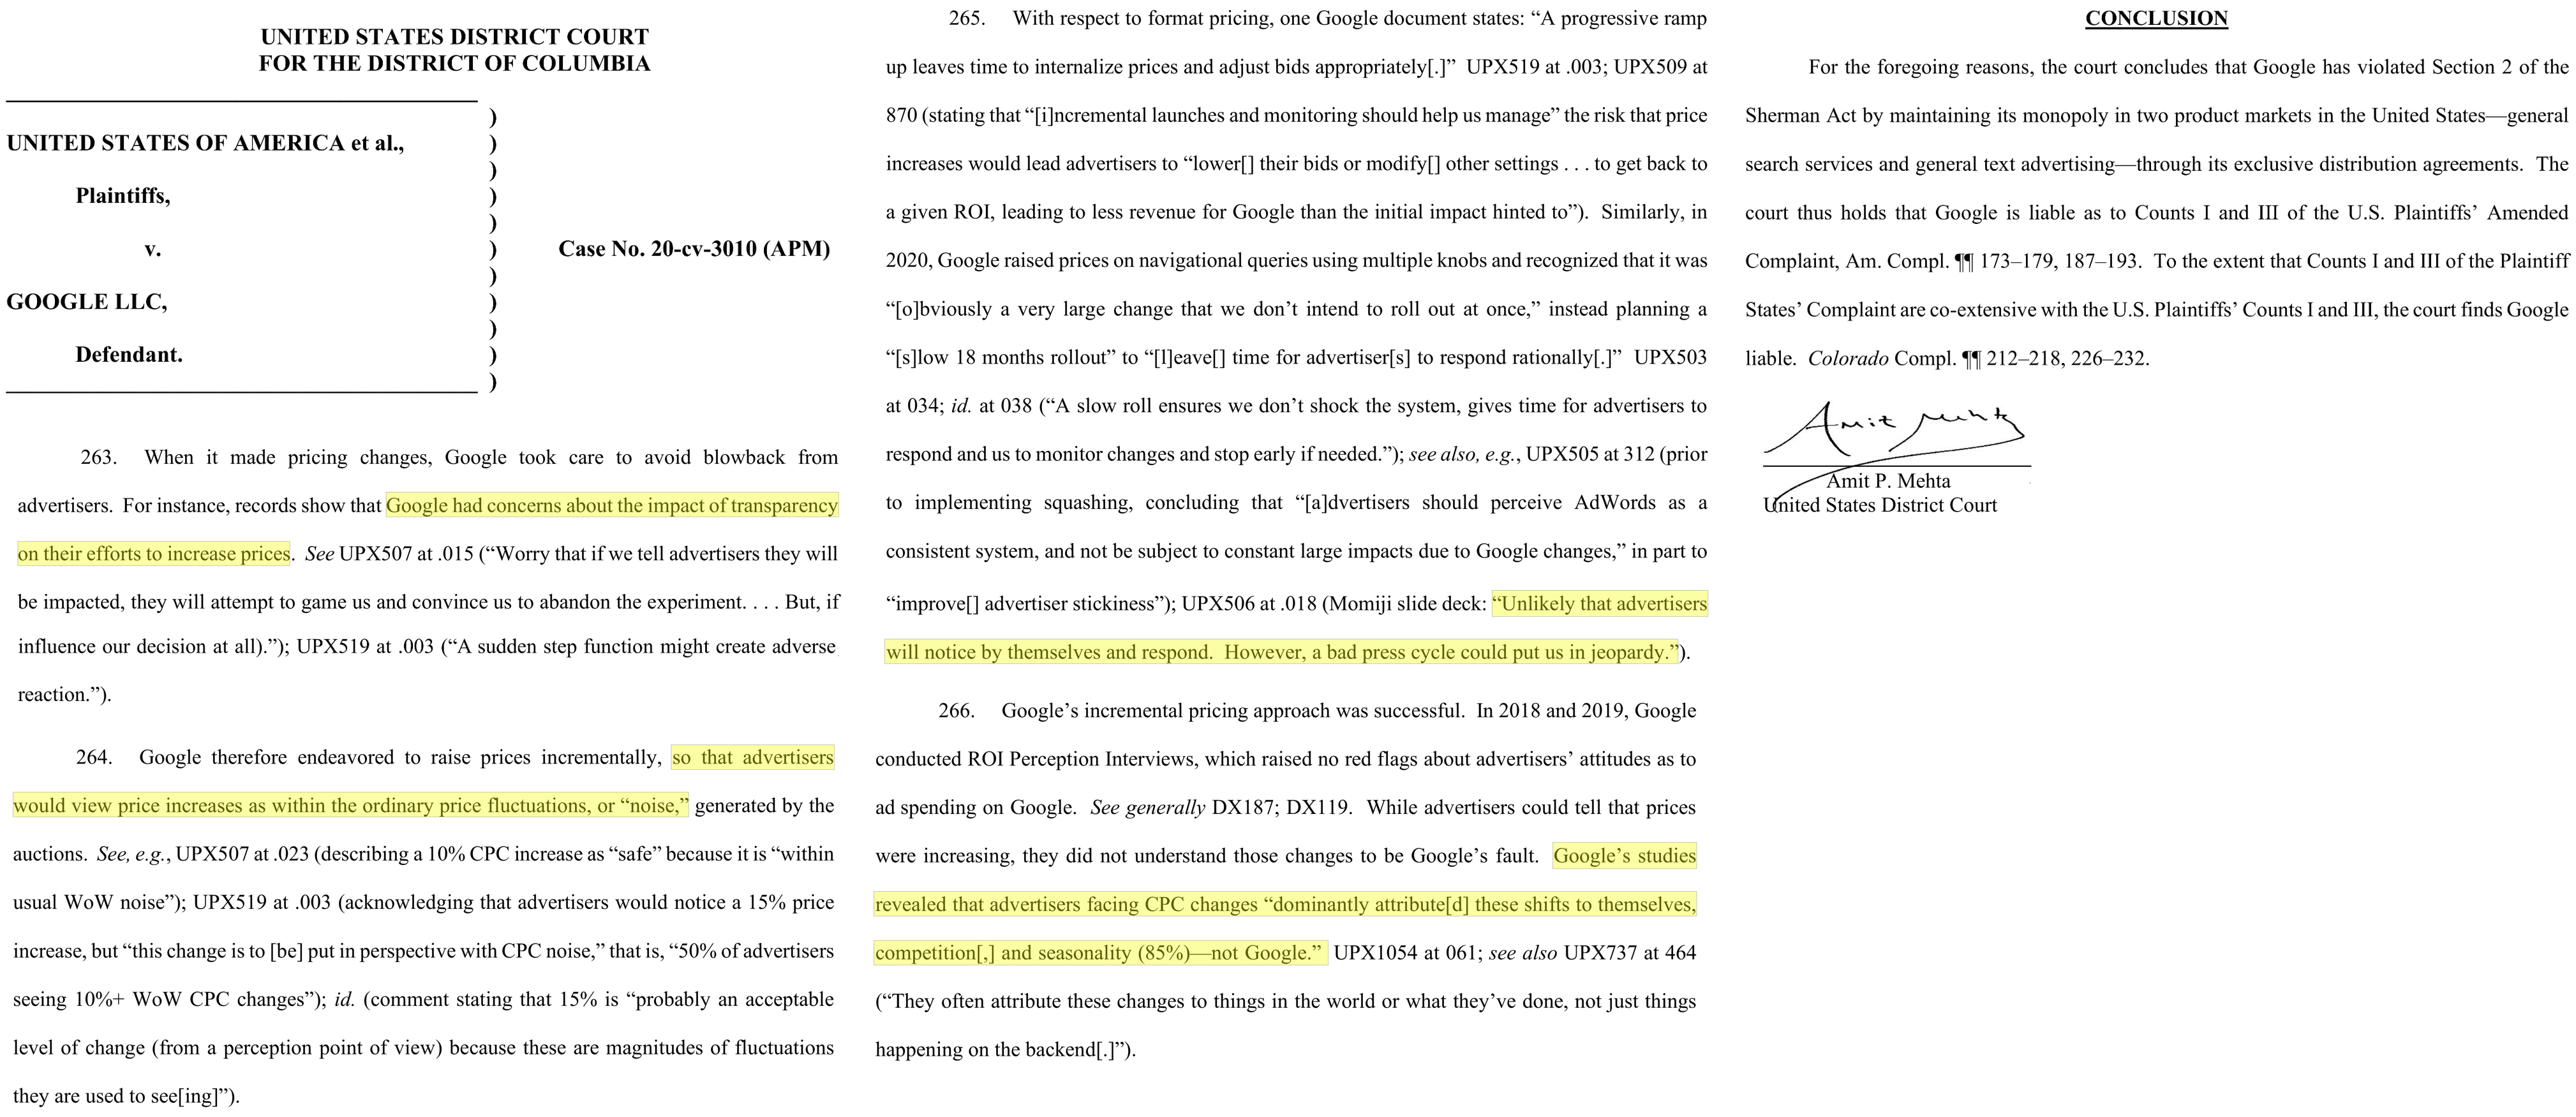
U.S. v Google (2024, search case)
Does Corr(ad,sales) work?
Why are some teams OK with corr(ad,sales)?
Some worry that if ads go to zero -> sales go to zero
 - For small firms or new products, without other marketing channels, this may be good logic
 - Downside of lost sales may exceed downside of foregone profits
 - However, premise implies deeper problems, i.e. need to diversify marketing efforts
 - Plus, we can run experiments without setting ads to zero, e.g. weight tests
Some firms assume that correlations indicate direction of causal results
 - The guy in the truck bed is pushing forwards right?
 - Biased estimates might lead to unbiased decisions (key word: "might")
 - But direction is only part of the picture; what about effect size?
Why are some teams OK with corr(ad,sales)?
CFO and CMO negotiate ad budget
 - CFO asks for proof that ads work
 - CMO asks ad agencies, platforms & marketing team for proof
 - CMO sends proof to CFO ; We all carry on
 - Should adFX team report to CFO or CMO?
Few rigorous analytics cultures or ex-post checks
- In some cultures, ex-post checks may threaten bonuses, turf; may get personal
Estimating causal effects of ads is not always easy
 - Many firms lack expertise, discipline, execution skill
 - Ad/sales tests may be statistically inconclusive, especially if small
 - Tests may be designed without subsequent action in mind, then fail to inform future decisions ("science fair projects")
Why are some teams OK with corr(ad,sales)?
Platforms often provide correlational ad/sales estimates
 - Which is larger, correlational or experimental ad effect estimates?
 - Which one might many client marketers prefer?
 - Platform estimates are typically "black box" without neutral auditors
 - Sometimes platforms respond to marketing clients' demand for good numbers
 - "Nobody ever got fired for buying [famous platform brand here]"
Historically, agencies usually estimated RoAS
 - Agency compensation usually relies on spending, not incremental sales
 - Principal/agent problems are common
 - Many marketing executives start at ad agencies
 - "Advertising attribution" is all about maximizing credit to ads
 - These days, more marketers have in-house agencies, and split work
      - I believe we're a few years into a generational shift
      - Smaller, independent ad agencies are making the most noise about incrementality
      - However, corr(ad,sales) is not going away
      - Union(correlations, experiments) should exceed either alone
      - But sometimes correlational measurement is misdescribed as causal
      - What happens when ad measurement is moved from CMO reporting to CFO?
Causal advertising measurement
Causal means that we rule out alternate explanations
Ad Experiments: Common Designs
Randomly assign ads to customer groups on a platform; measure sales in each group
- Pros: AB testing is easy to understand, rules out alternate explanations
- Cons: Can we trust the platform's "black box"? Will we get the data and all available insights?
Randomize messages within a campaign. Mine competitor messages in ad libraries for ideas
- Often a great place to start
Randomize budget across times & places (“Geo tests”)
Randomize bids and/or consumer targeting criteria
Randomize budget over platforms, publishers, behavioral targets, contexts
  - Experimental design describes how we create data to enable treatment/control comparisons. Experimental data are amenable to any number of models or statistical analyses.
  - Causal identification is a property of the data, not the model
Experimental necessary conditions
Stable Unit Treatment Value Assumption (SUTVA)
 - Treatments do not vary across units within a treatment group
 - One unit's treatment does not change other units' potential outcomes, i.e. treatments in one group do not affect outcomes in another group
 - May be violated when treated units interact on a platform
 - E.g., successful ad campaign could deplete inventory, leading to periods of product nonavailability, thereby changing other treated consumers' outcomes
 - Violations called "interference"; remedies usually start with cluster randomization
Observability
- Non-attrition, i.e. unit outcomes remain observable
Compliance
 - Treatments assigned are treatments received
 - We have partial remedies when noncompliance is directly observed
Statistical Independence
- Random assignment of treatments to units
Muy importante
Before you kick off your test …
    - Run A:A test before your first A:B test. Validate the infrastructure before you rely on the result. A:A test can fail for numerous reasons

    - Can we agree on the opportunity cost of the experiment? "Priors"

    - How will we act on the (uncertain) findings? Have to decide before we design. We don't want "science fair projects"

    - Simple example: Suppose we estimate iROAS at 1.5 with c.i. [1.45, 1.55]. Or, suppose we estimate RoAS at 1.5 with c.i. [-1.1, 4.1]. What actions would follow each?
Platform experiments advisory
Some advertising platforms offer on-platform experiments
Most of them randomize ads across platform & consumers; not just consumers
    - Randomization occurs before ad targeting & distribution algorithms
    - You're "treating" the algorithms that determine ad distribution, not randomly selecting consumers holding everything else constant
Prominent exception: Ghost ads, an ingenious system to randomly withhold ads from auctions in order to estimate causal ad effects
Productive experiments …
serve customer interests
- Working against customers drives customers away
live within theoretical frameworks
    - Science requires hypotheses if we want to learn from tests
    - Theoretical frameworks offer mechanisms and solutions
test quantifiable hypotheses
- Choose test size & statistical power based on hypothesis
analyze all relevant customer metrics
    - Test positive & negative metrics, e.g. conversions & bounce rates
    - Test SR & LR metrics, e.g. trial & repurchase
    - Classic example: Pop-ups seeking email subscriptions
acknowledge possible interactions between variables
- E.g. price advertising effects will always depend on the price
Quasi-experiments Vocab
Model: Mathematical relationship between variables that simplifies reality, eg y=xb+e
Identification strategy: Set of assumptions that isolate a causal effect \(\frac{\partial Y_i}{\partial T_i}\) from other factors that may influence \(Y_i\)
- A strategy to compare apples with apples, not apples with oranges
We say we “identify” the causal effect if we have an identification strategy that reliably distinguishes \(\frac{\partial Y_i}{\partial T_i}\) from possibly correlated unobserved factors that also influence \(Y_i\)
If you estimate a model without an identification strategy, you should interpret the results as correlational
- This is widely, widely misunderstood
You can have an identification strategy without a model, e.g. \(\text{avg\{Y_i(T_i=1)-Y_i(T_i=0)\}}\)
Usually you want both. Models reduce uncertainty by controlling for covariates and enable counterfactual predictions
Ad/sales: Quasi-experiments
Goal: Find a “natural experiment” in which \(T_i\) is “as if” randomly assigned, to identify \(\frac{\partial T_i}{\partial Y_i}\)
Possibilities:
      - Firm started, stopped or pulsed advertising without changing other variables, especially when staggered across times or geos
      - Competitor starts, stops or pulses advertising
      - Discontinuous changes in ad copy
      - Exogenous changes in ad prices, availability or targeting (e.g., elections)
      - Exogenous changes in addressable market, website visitors, or other factors
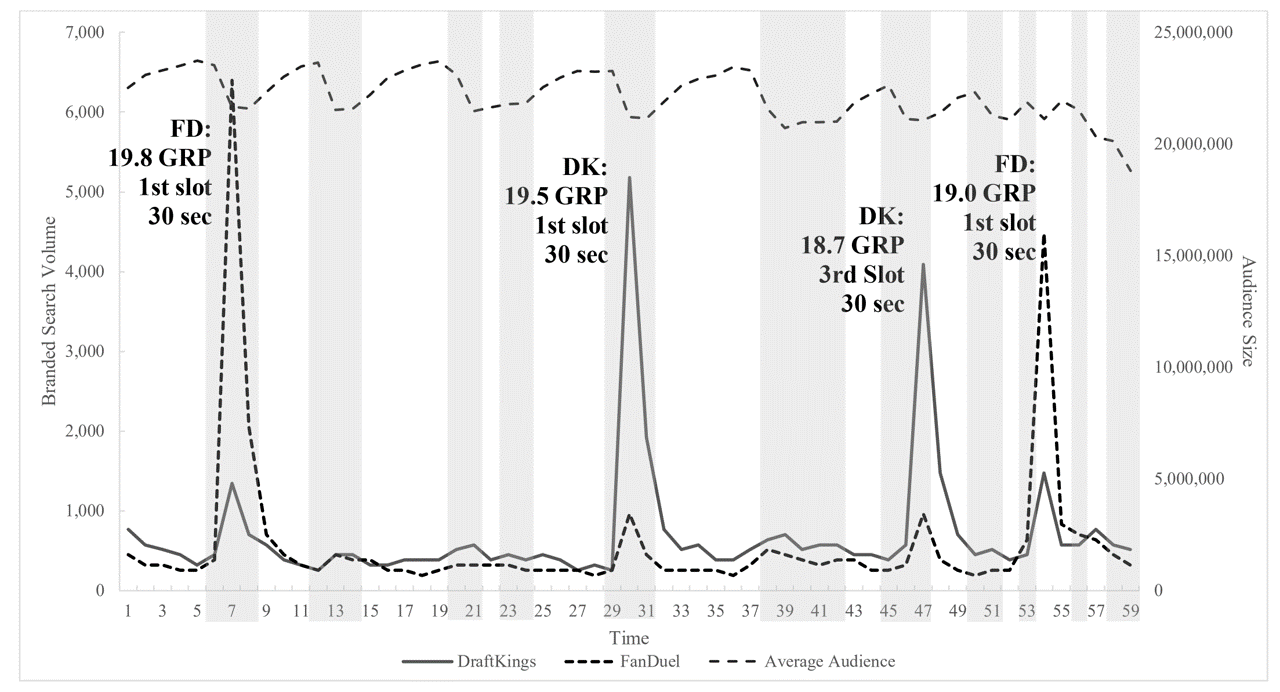
DFS TV ad effects on Google Search
Ad/sales: Quasi-experiments (2)
Or, construct a “quasi-control group”
Customers or markets with similar demand trends where the firm never advertised
Competitors or complementors with similar demand trends that don’t advertise
In each case, we try to predict our missing counterfactual data, then estimate the causal effect as observed outcomes minus predicted outcomes
E.g., Shapiro et al. (2021) used the county-border approach to identify excessive TV advertising
Experiments vs. Quasi-experiments
Experimentalists and quasi-experimentalists differ in beliefs, cultures & training
- not unlike bayesians v frequentists
Generally speaking, quasi-experiments :
  - Always depend on untestable assumptions (as do experiments)
  - Are bigger, faster & cheaper than experiments when valid
  - Will lead us astray when not valid
  - Are easy to apply without validity
  - Range from difficult to impossible to validate. We can evaluate treatment & control similarity on observables, but not on unobservables
Experiments & quasi-experiments should be “yes-if-valid,” not “either-or”
Industry practices
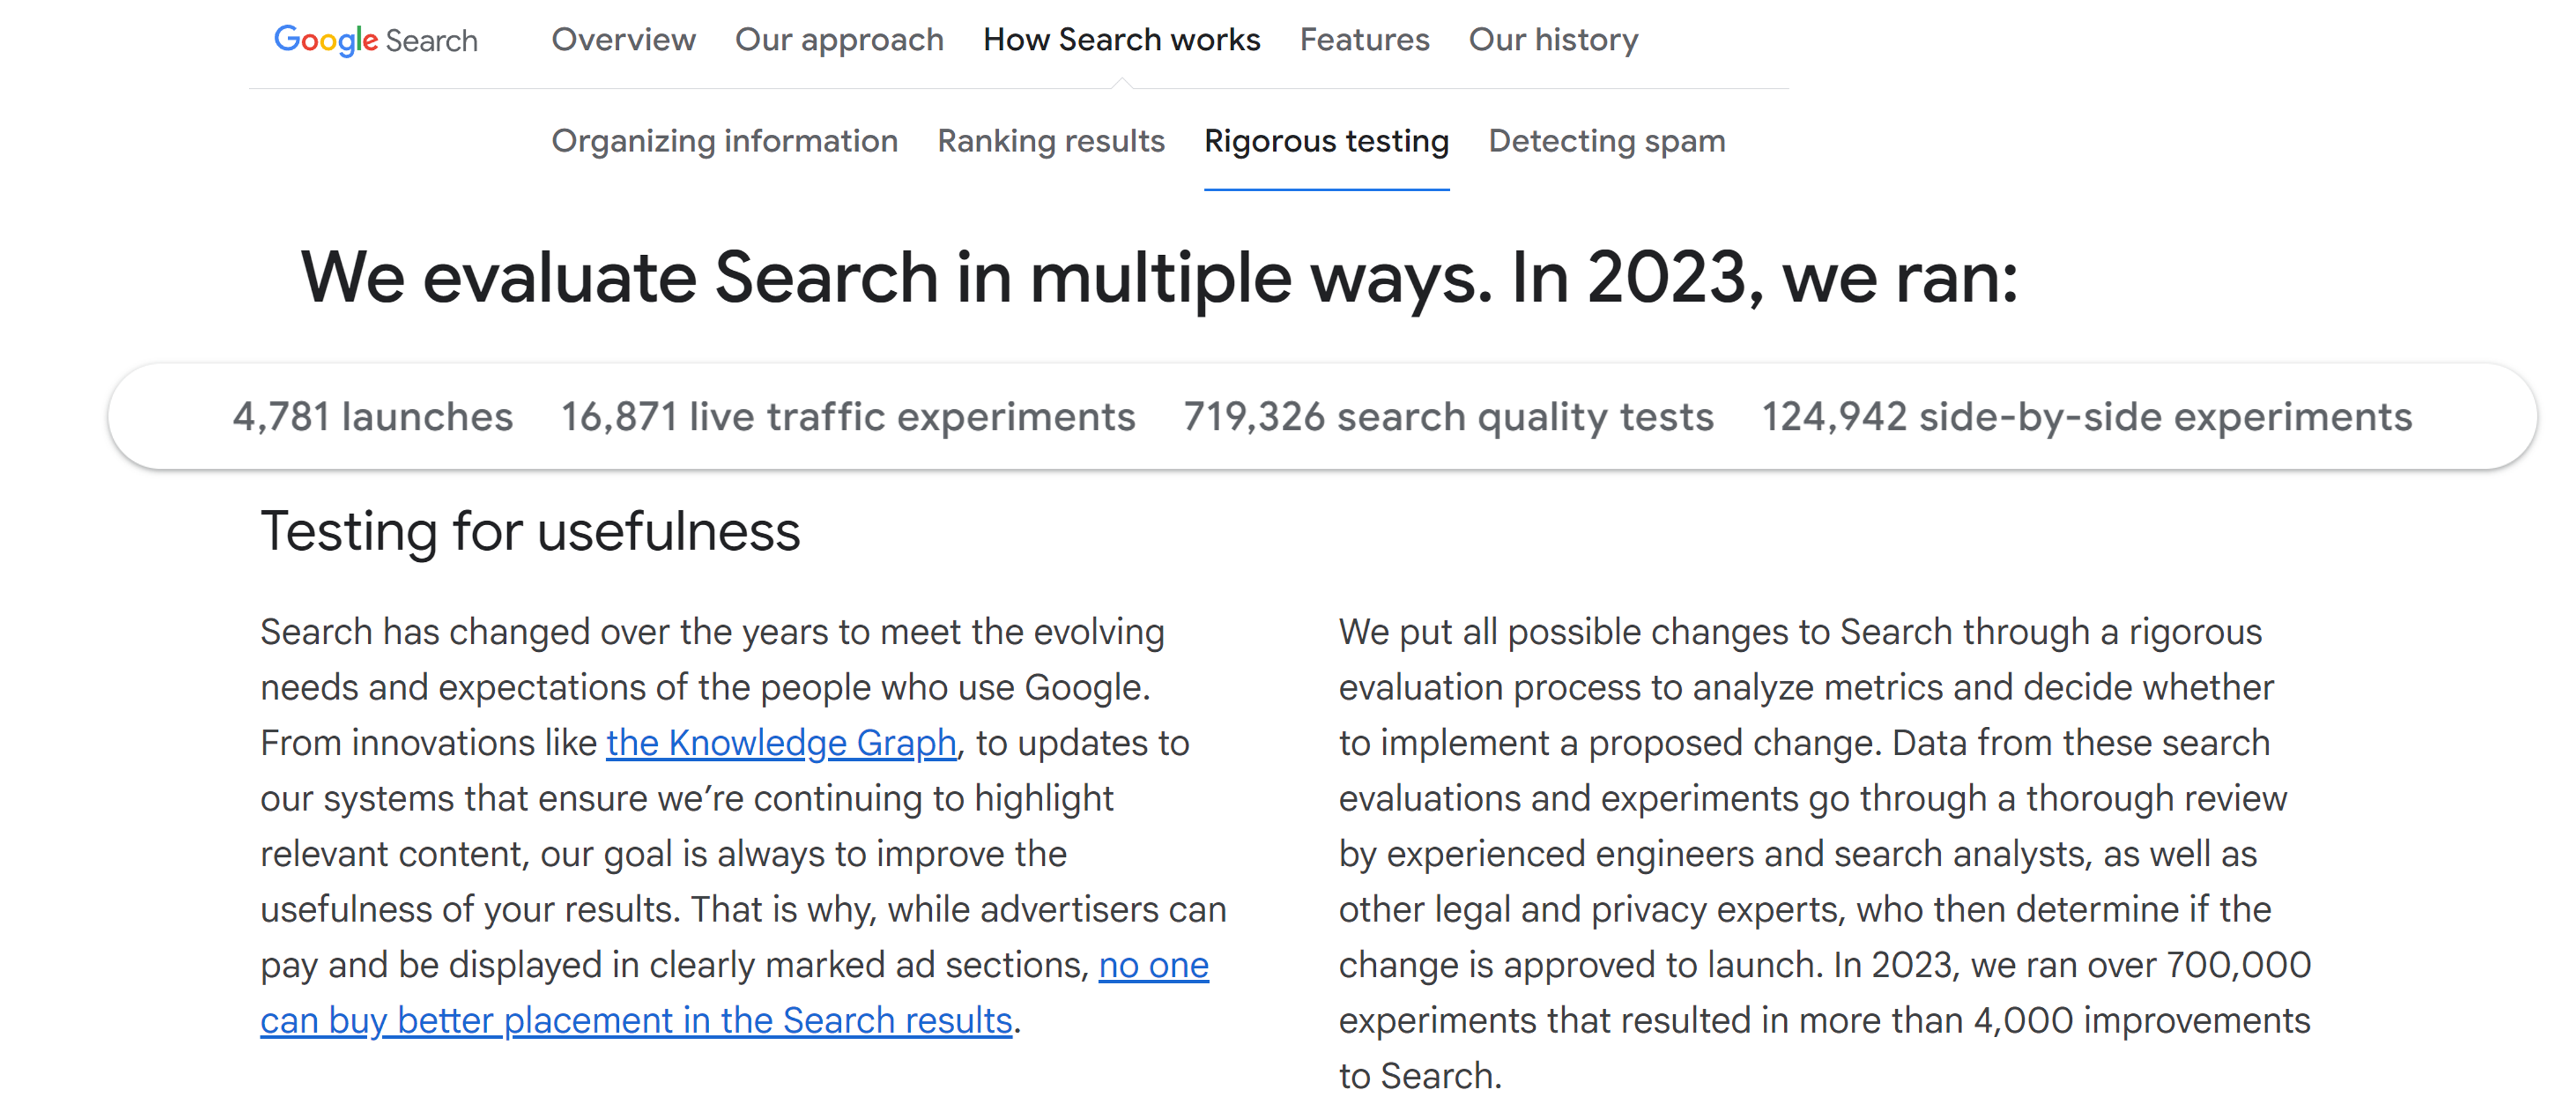
Who tests the most?
“To invent you have to experiment, and if you know in advance that it’s going to work, it’s not an experiment.” –Bezos, Amazon
“In a culture that prioritizes curiosity over innate brilliance, ‘the learn‑it‑all does better than the know‑it‑all.’” –Nadella, Microsoft
“We ship imperfect products but we have a very tight feedback loop and we learn and we get better.” –Altman, OpenAI
“You do a lot of experimentation, an A/B test to figure out what you want to do.” –Chesky, Airbnb
“The only way to get there is through super, super aggressive experimentation.” –Khosrowshahi, Uber
“Create an A/B testing infrastructure.” Huffman, on his top priority as Reddit CEO
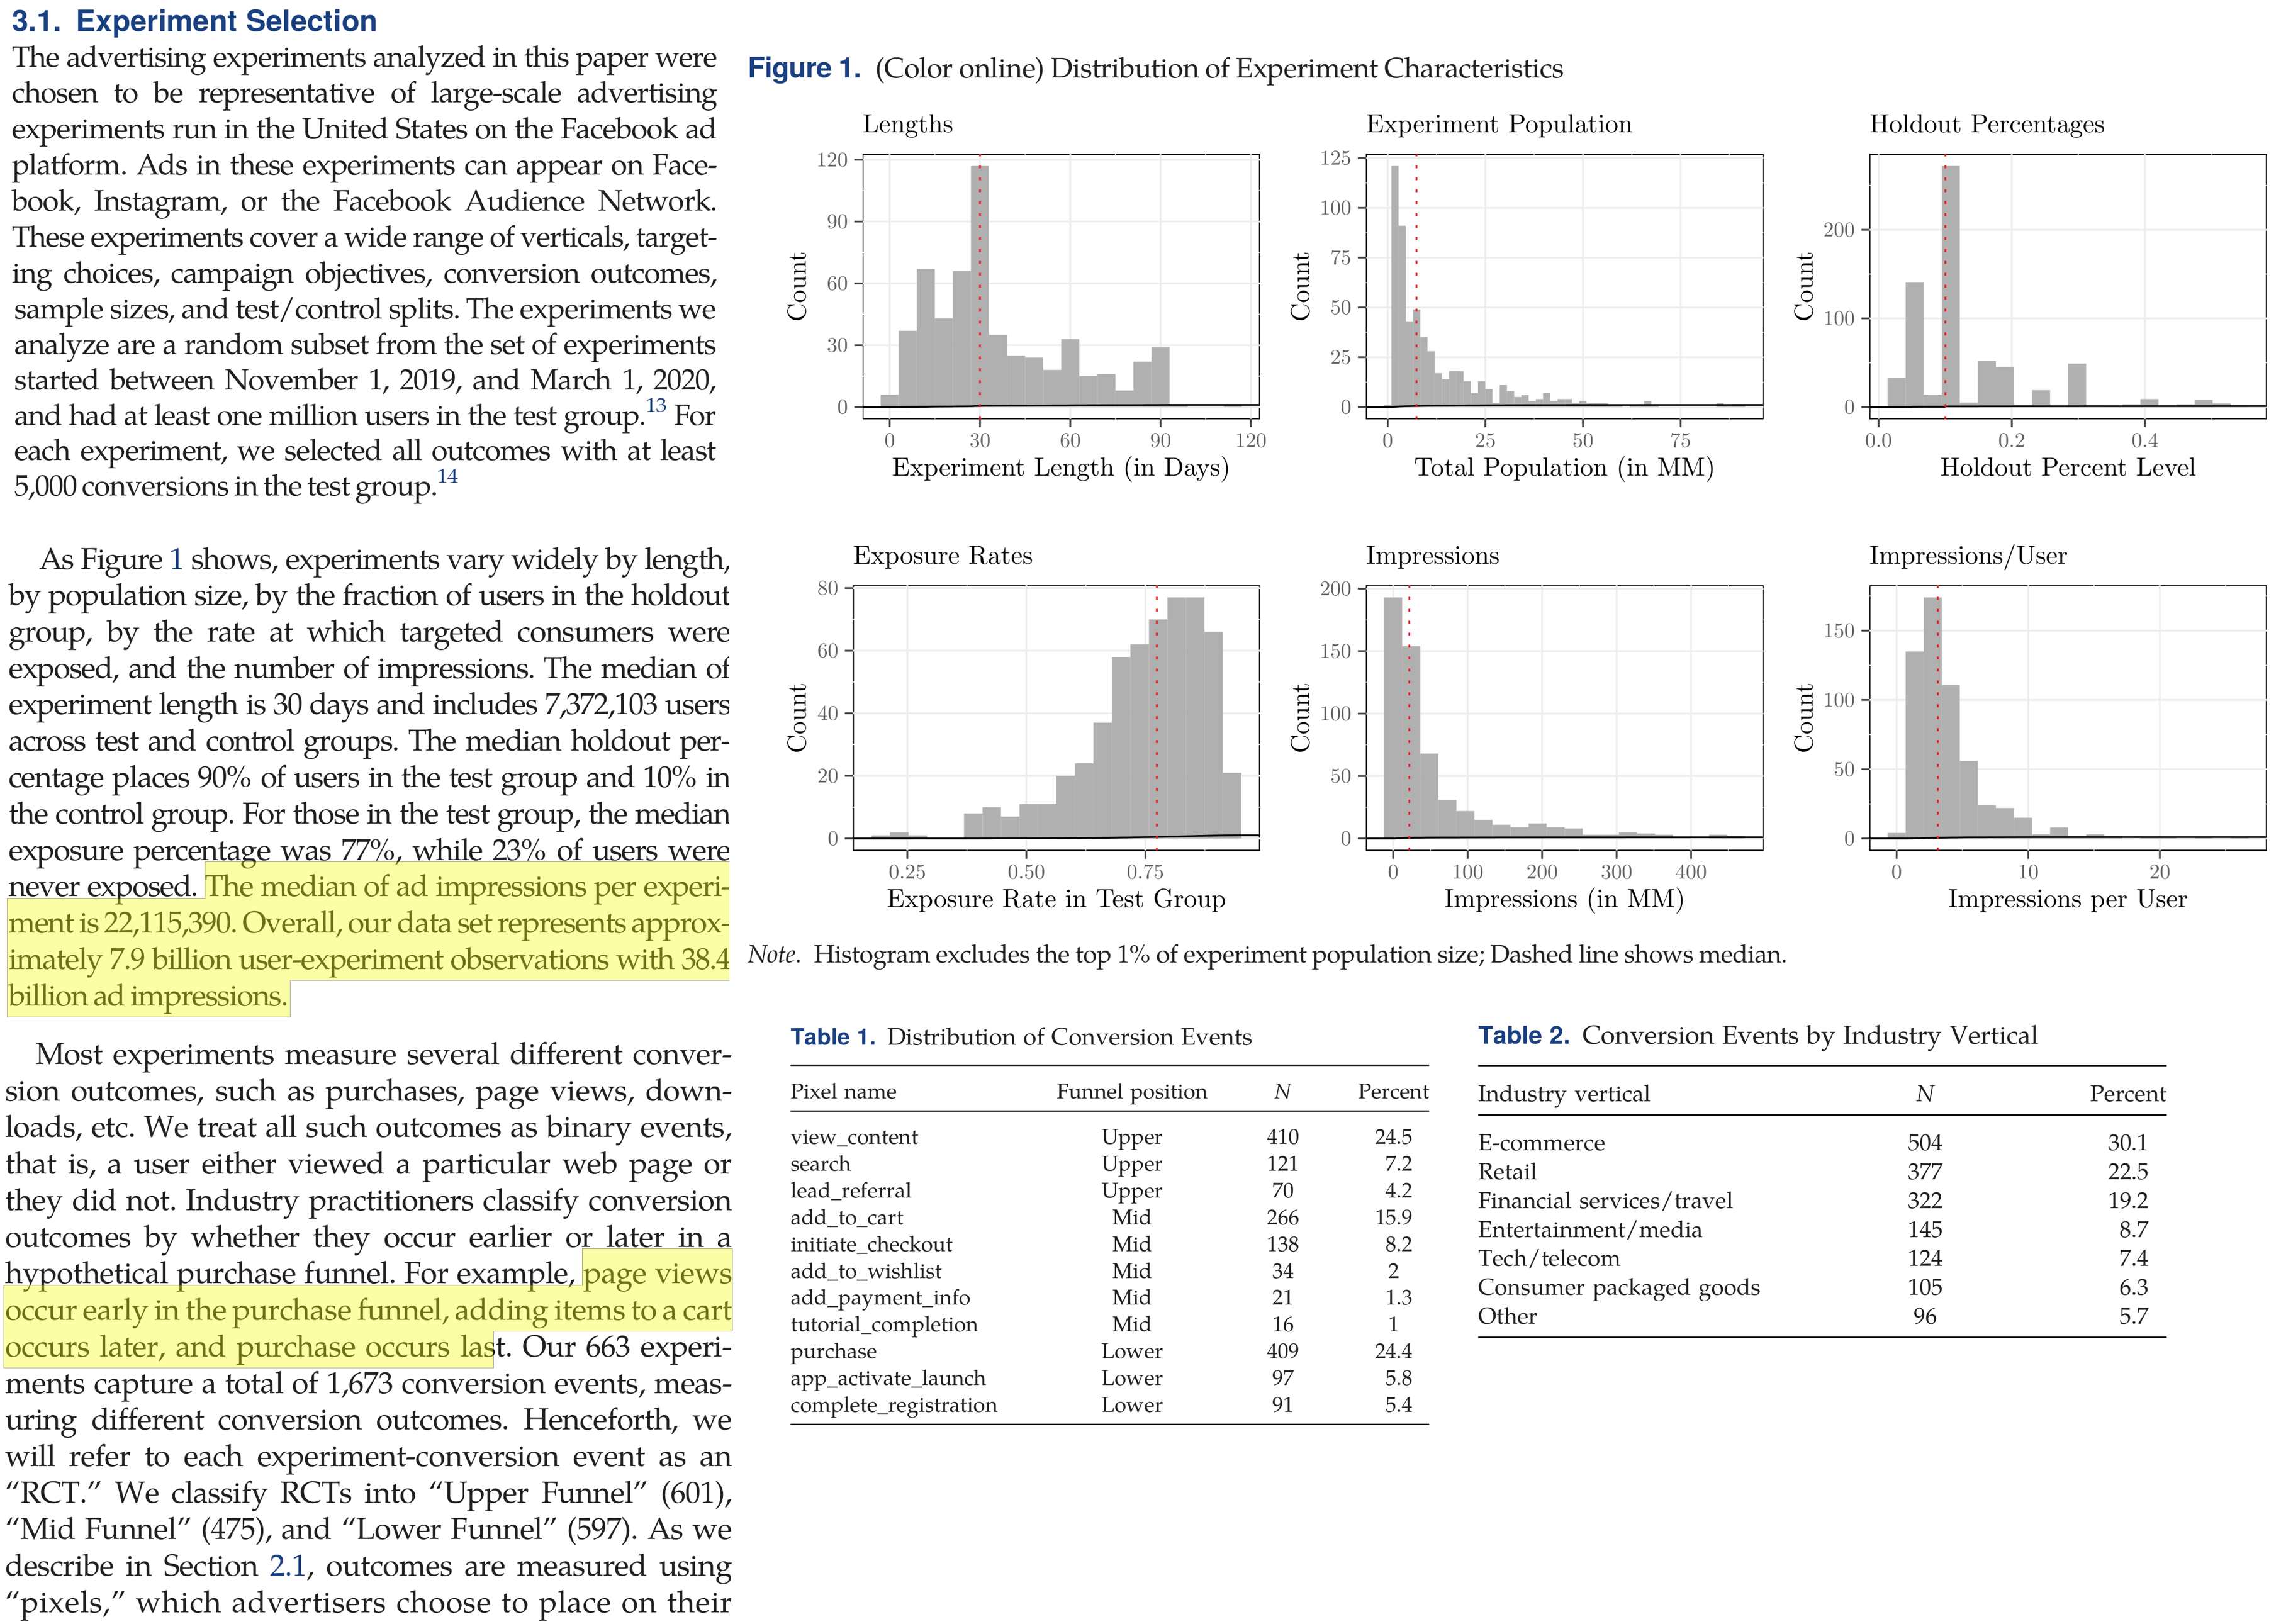
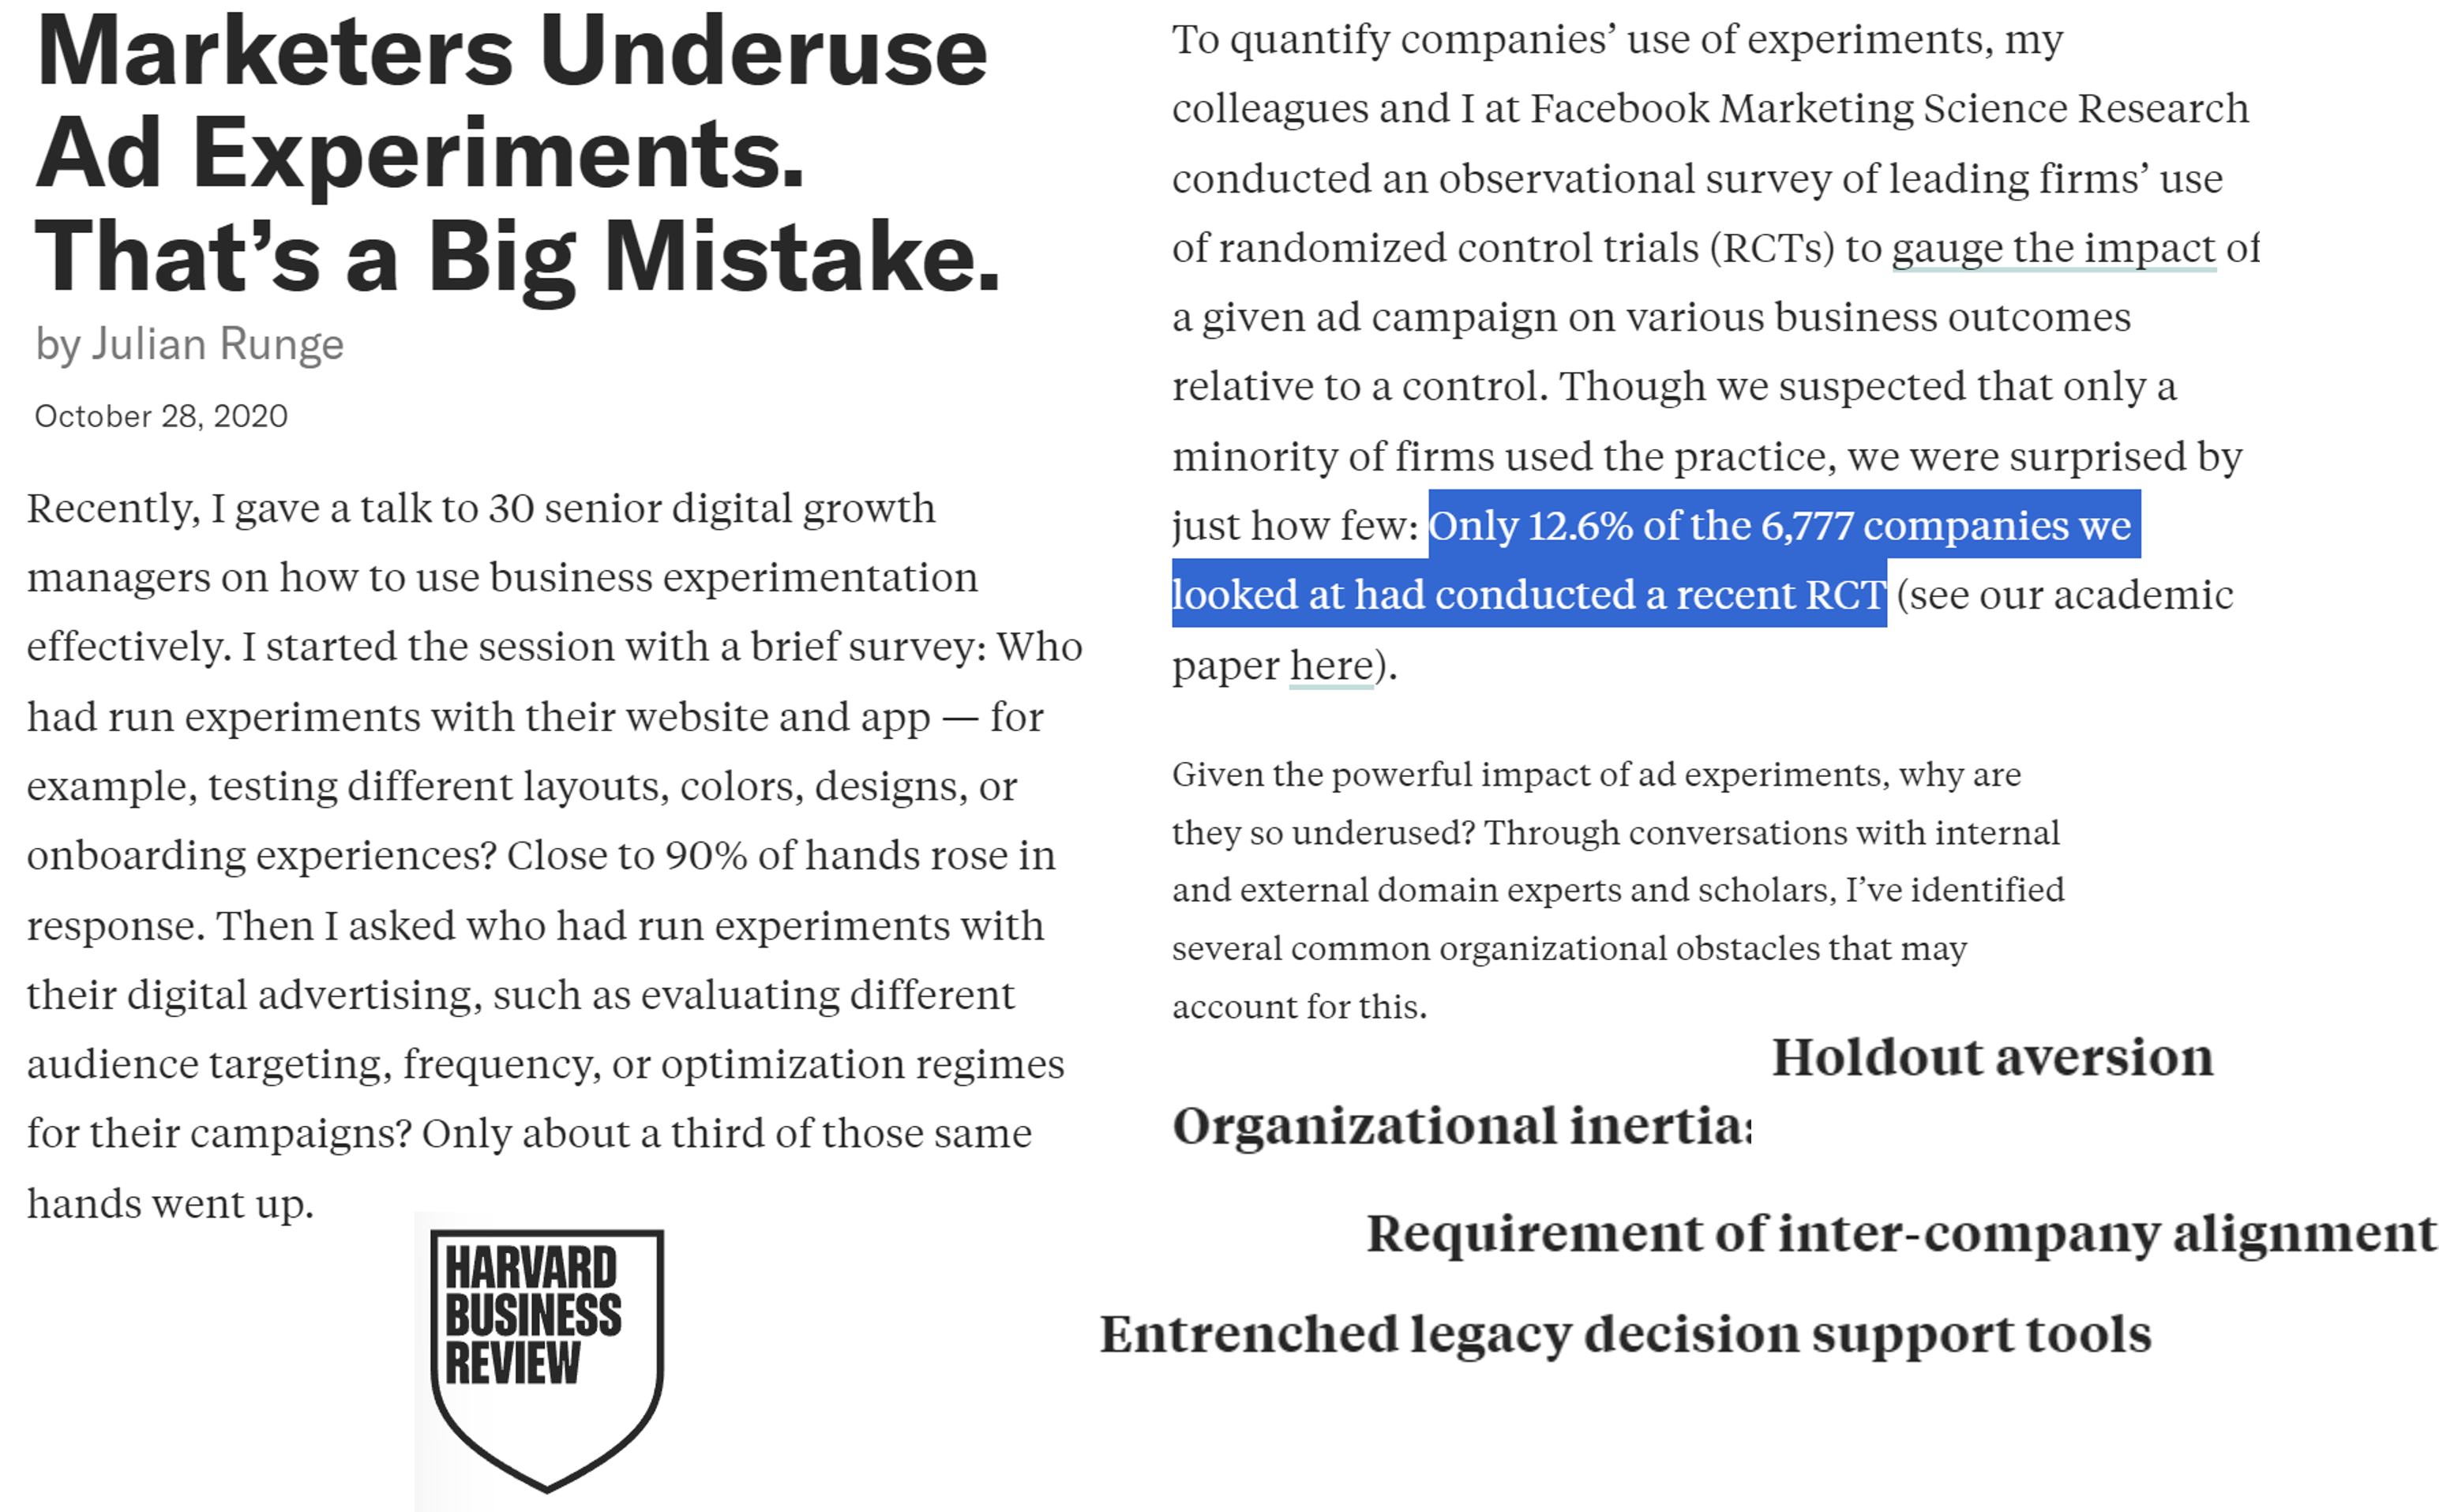
Advertising experiment frequency
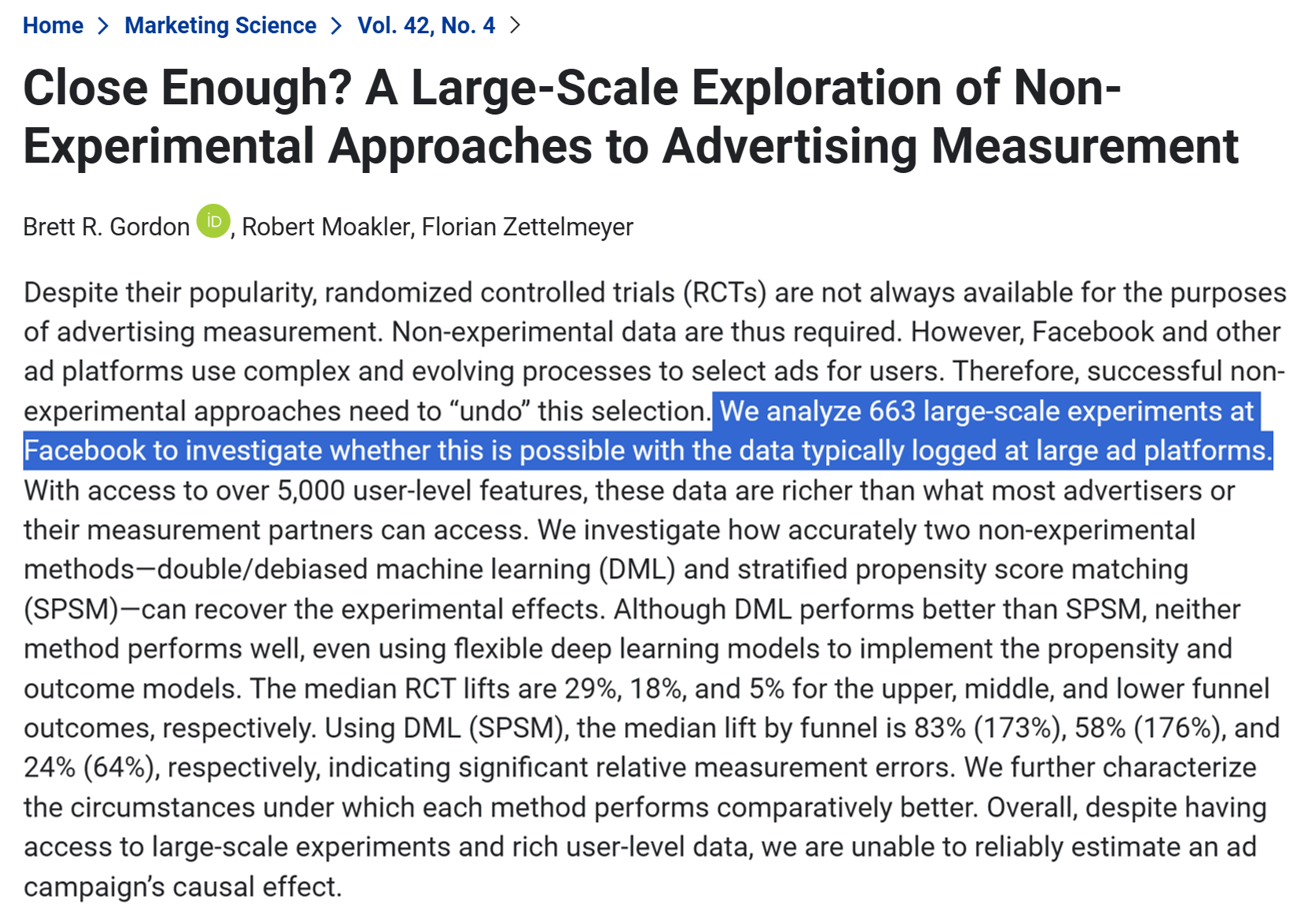
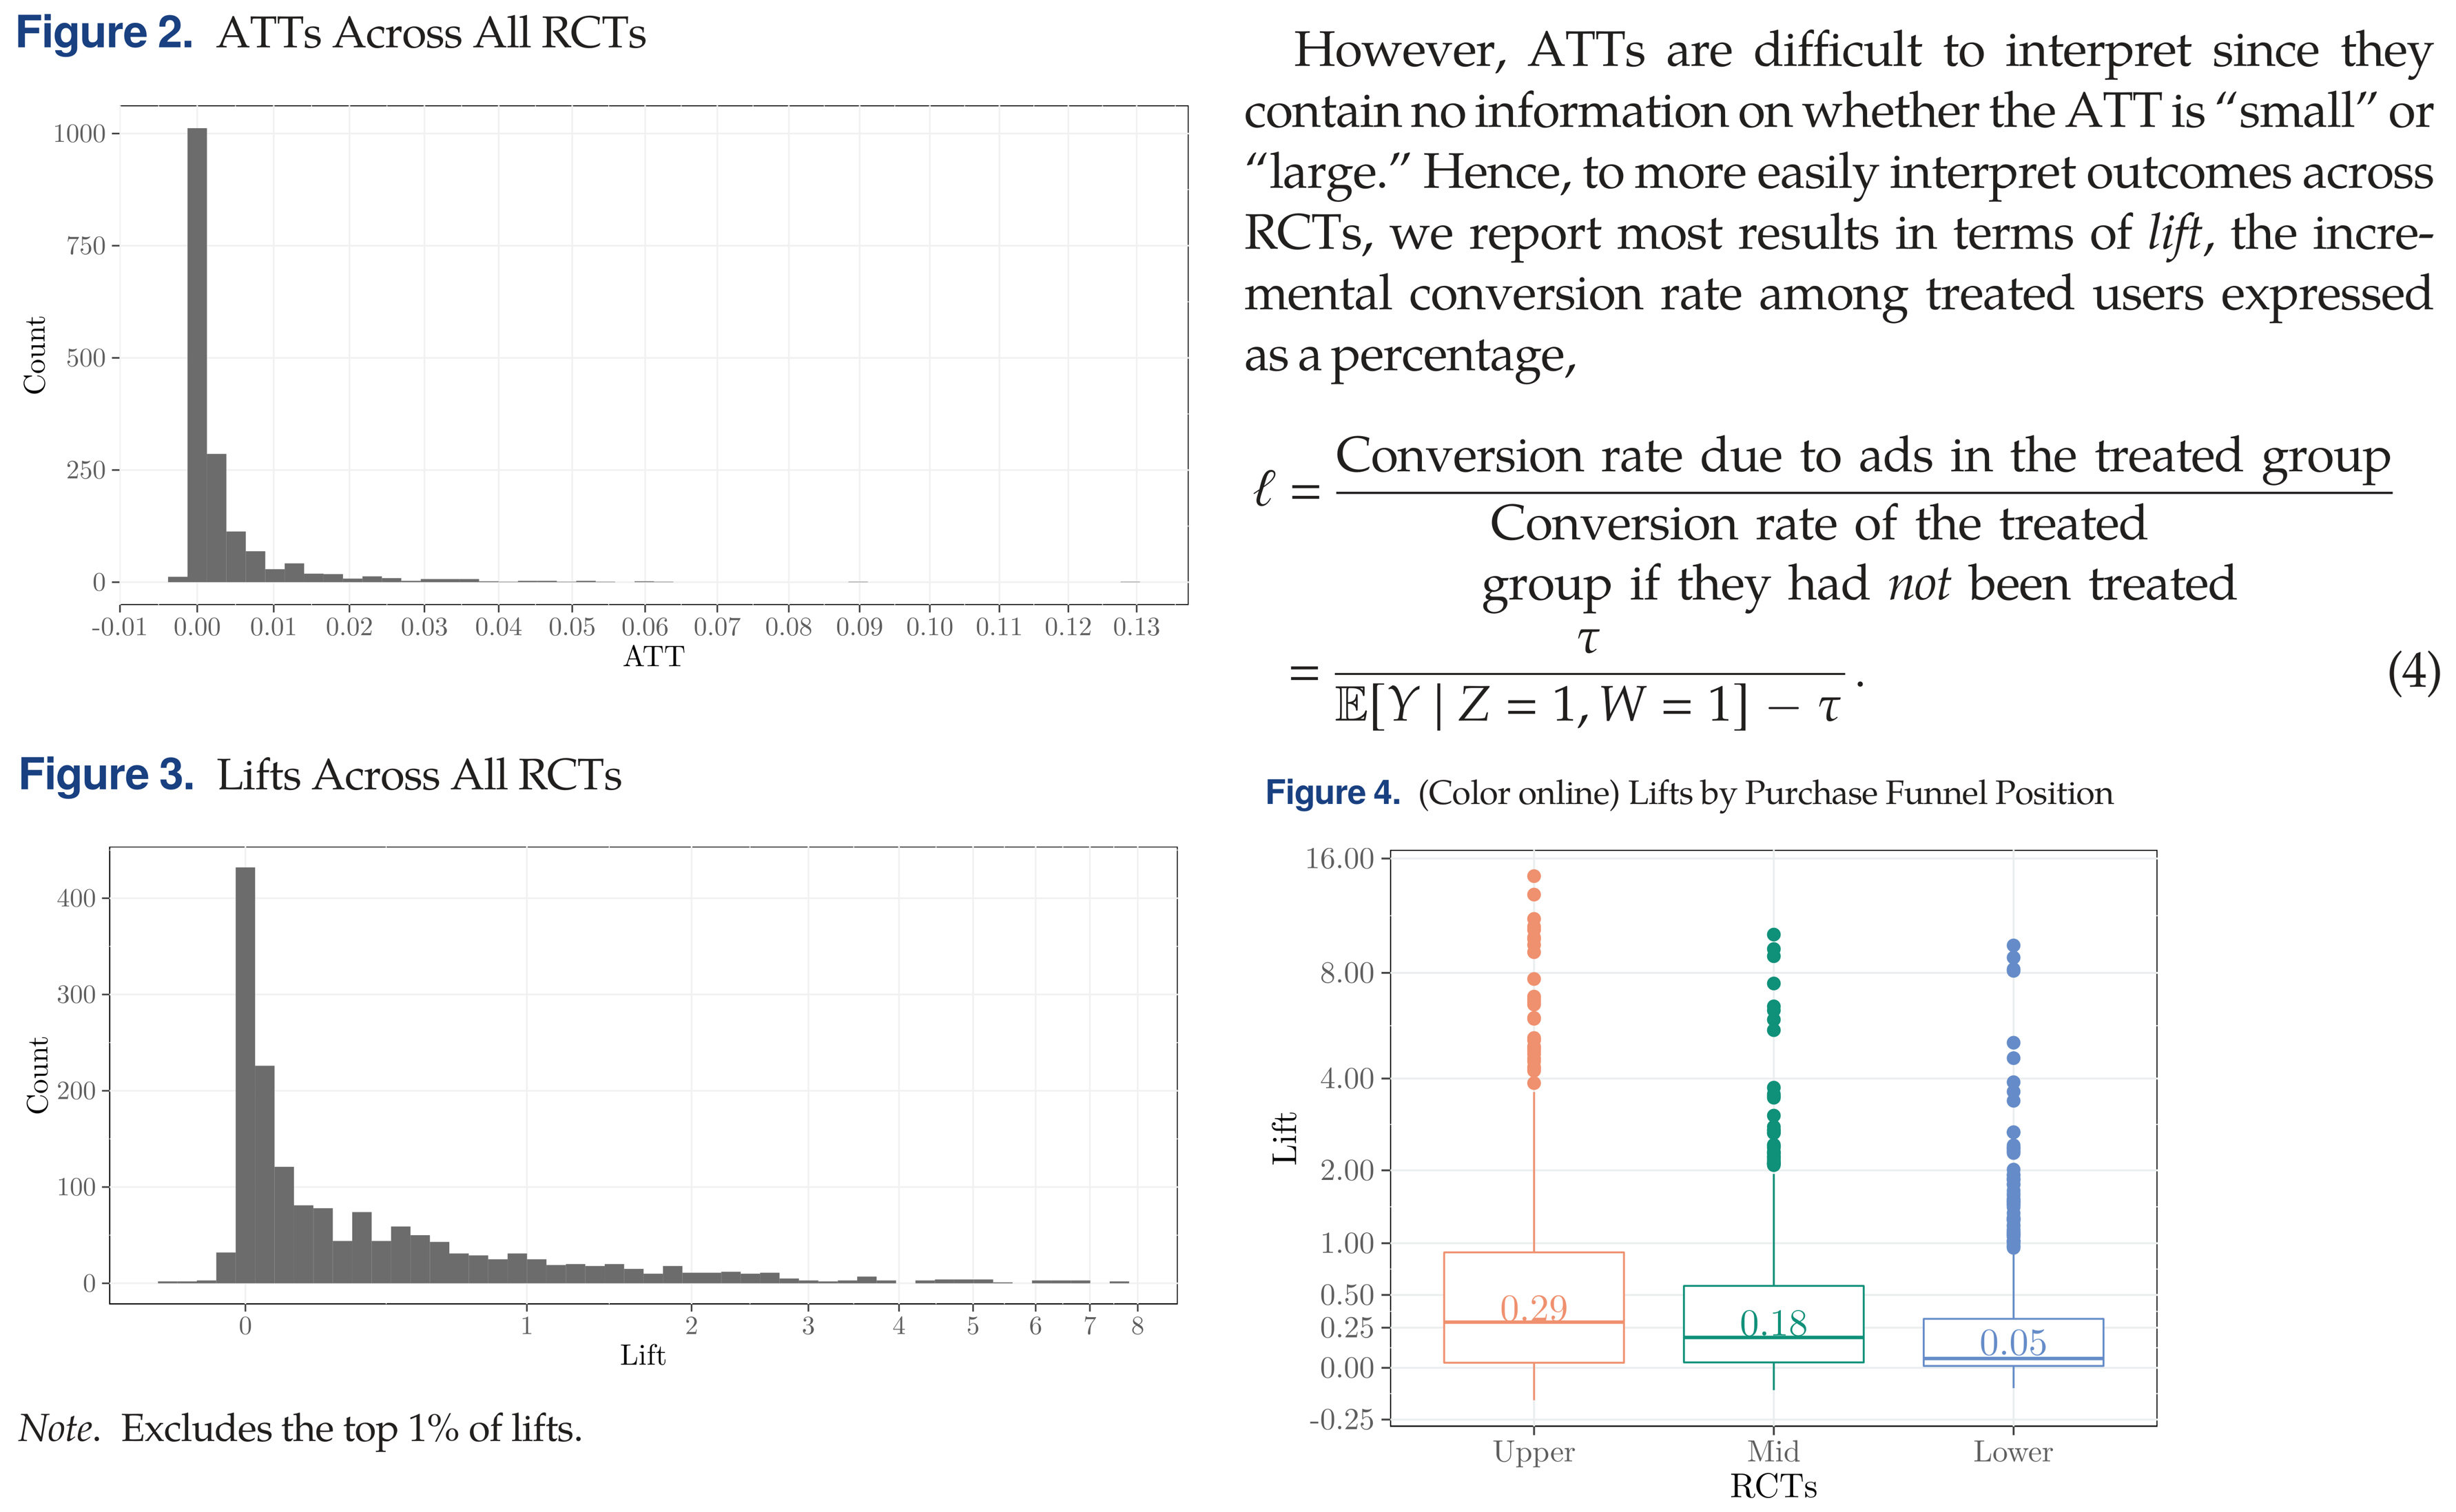
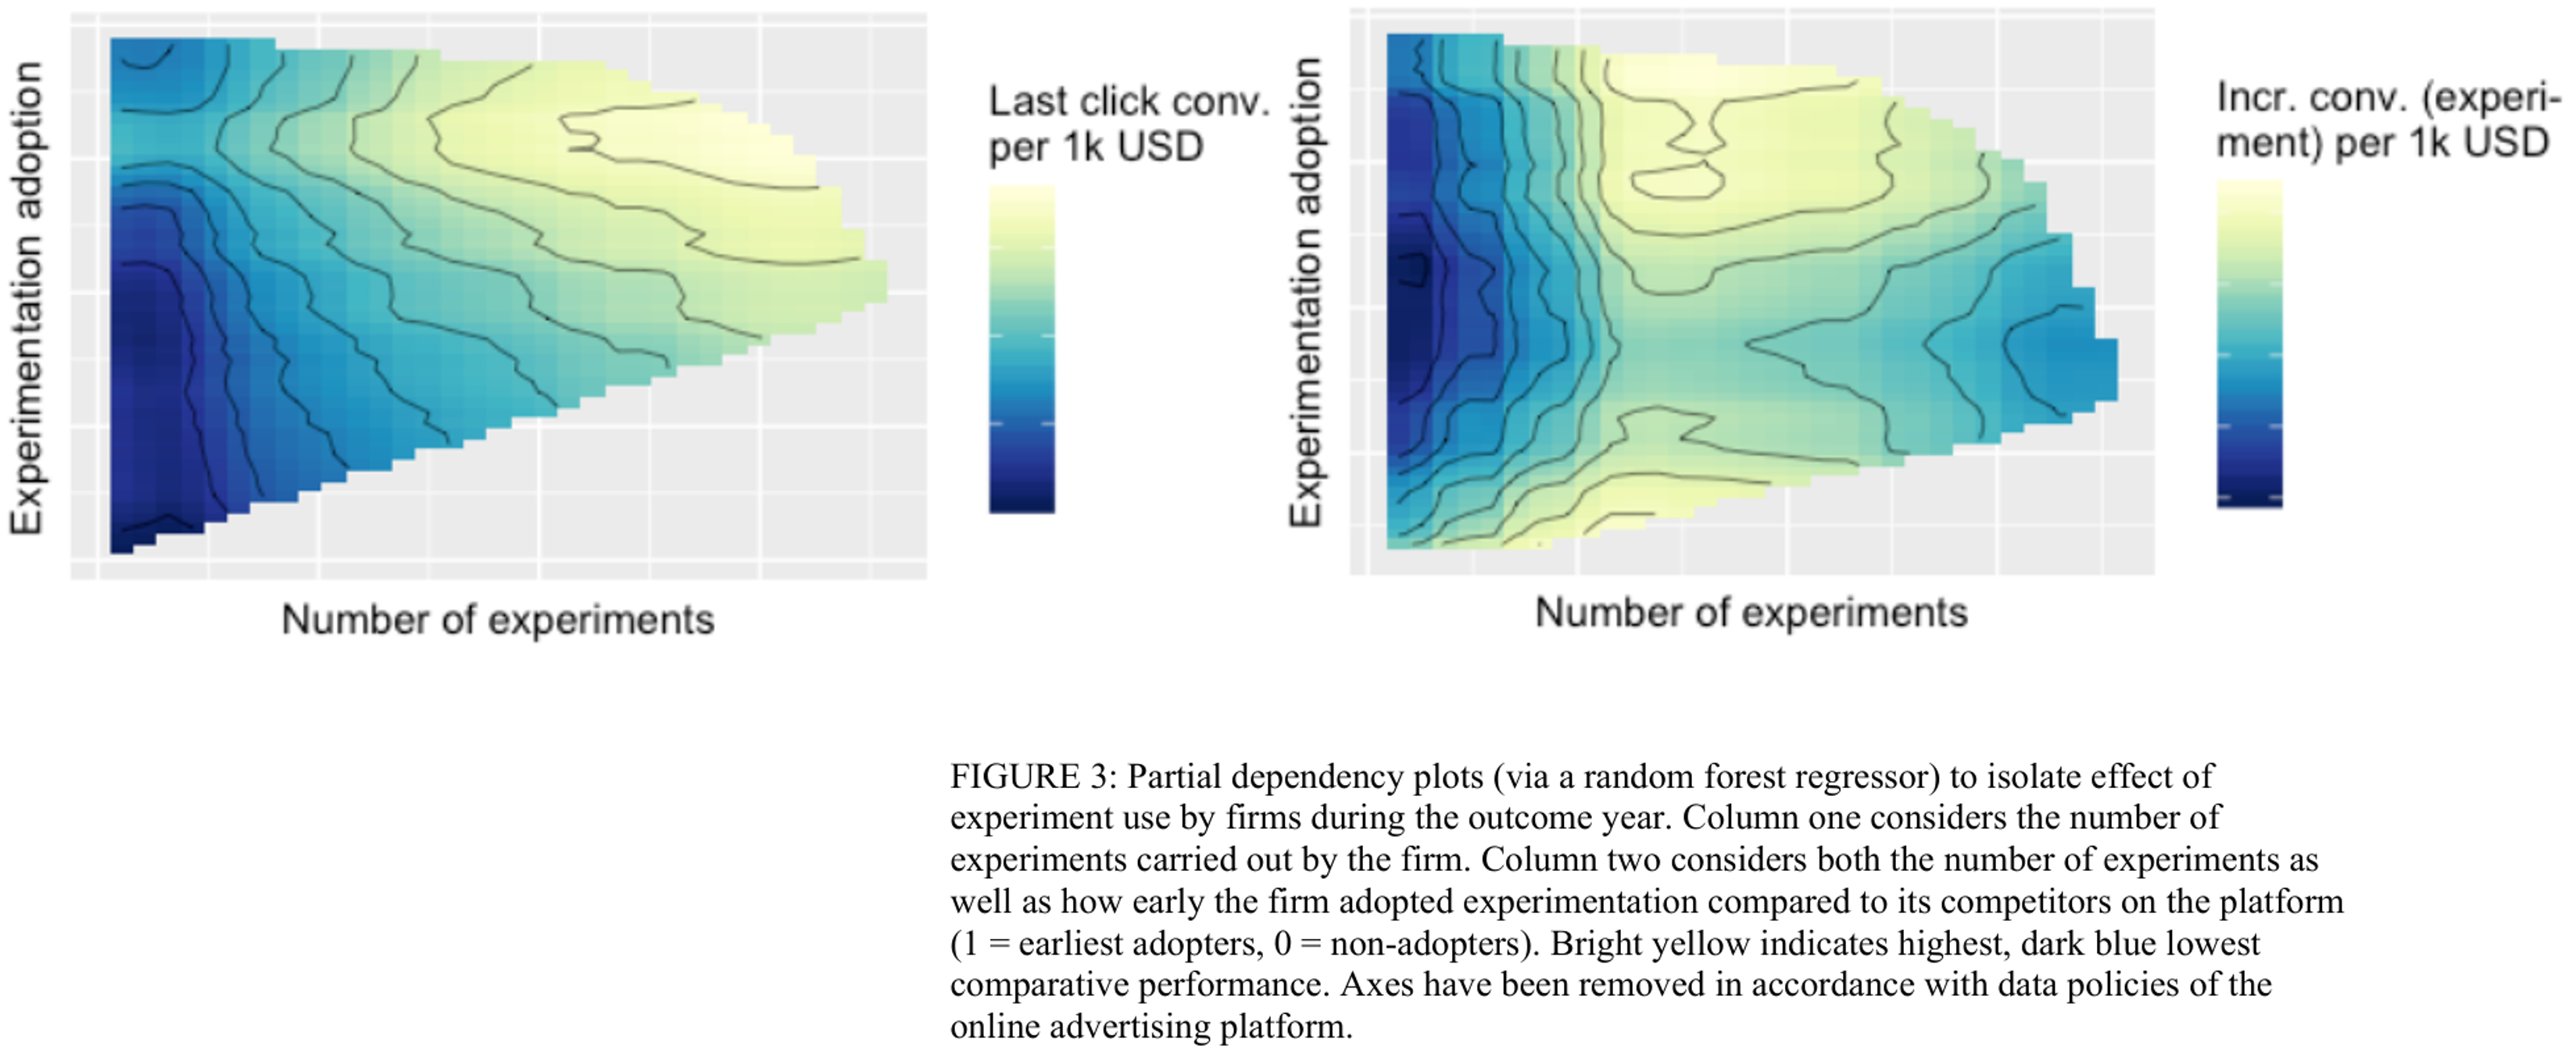
Advertising experiment effectiveness
- Authors describe how companies' experimental practices relate to last-click conversion/ad$ metrics, and incremental conversions/ad$ in Meta experiments
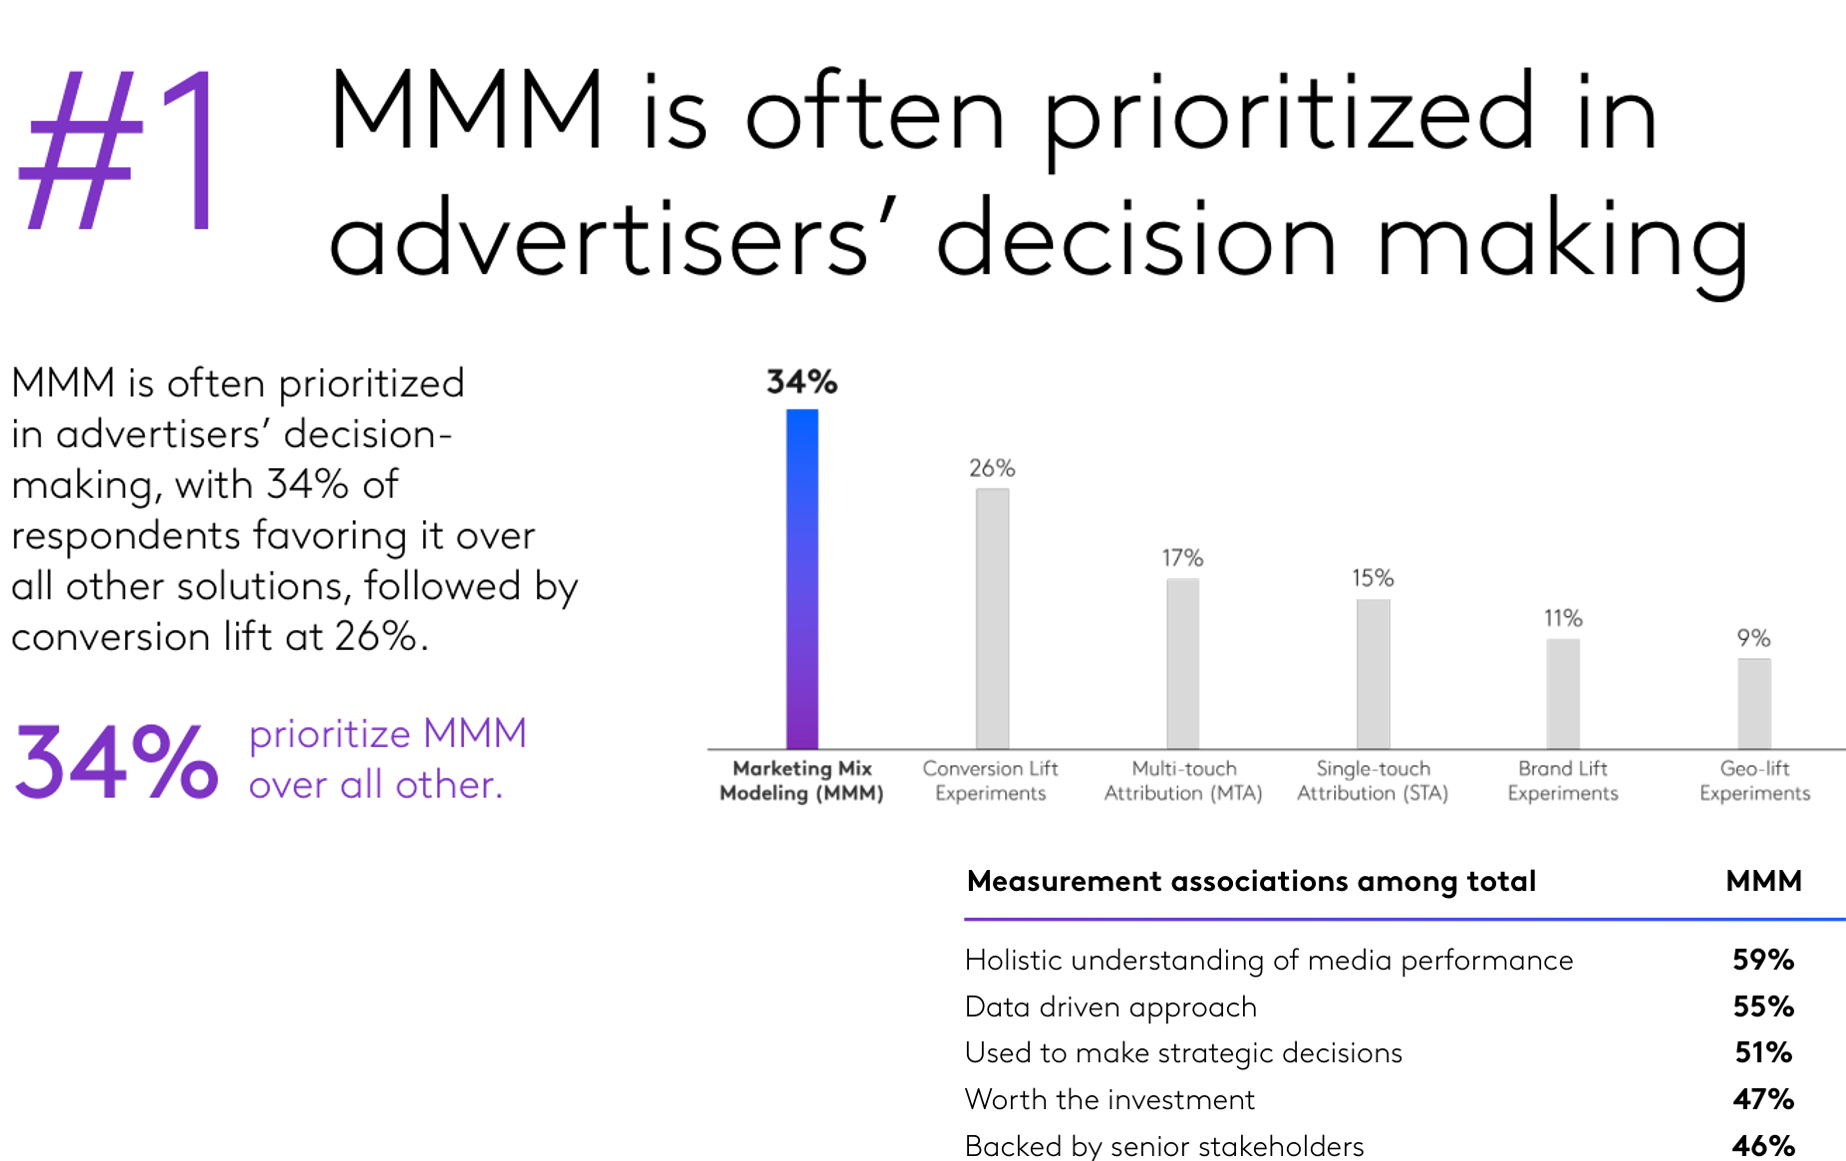
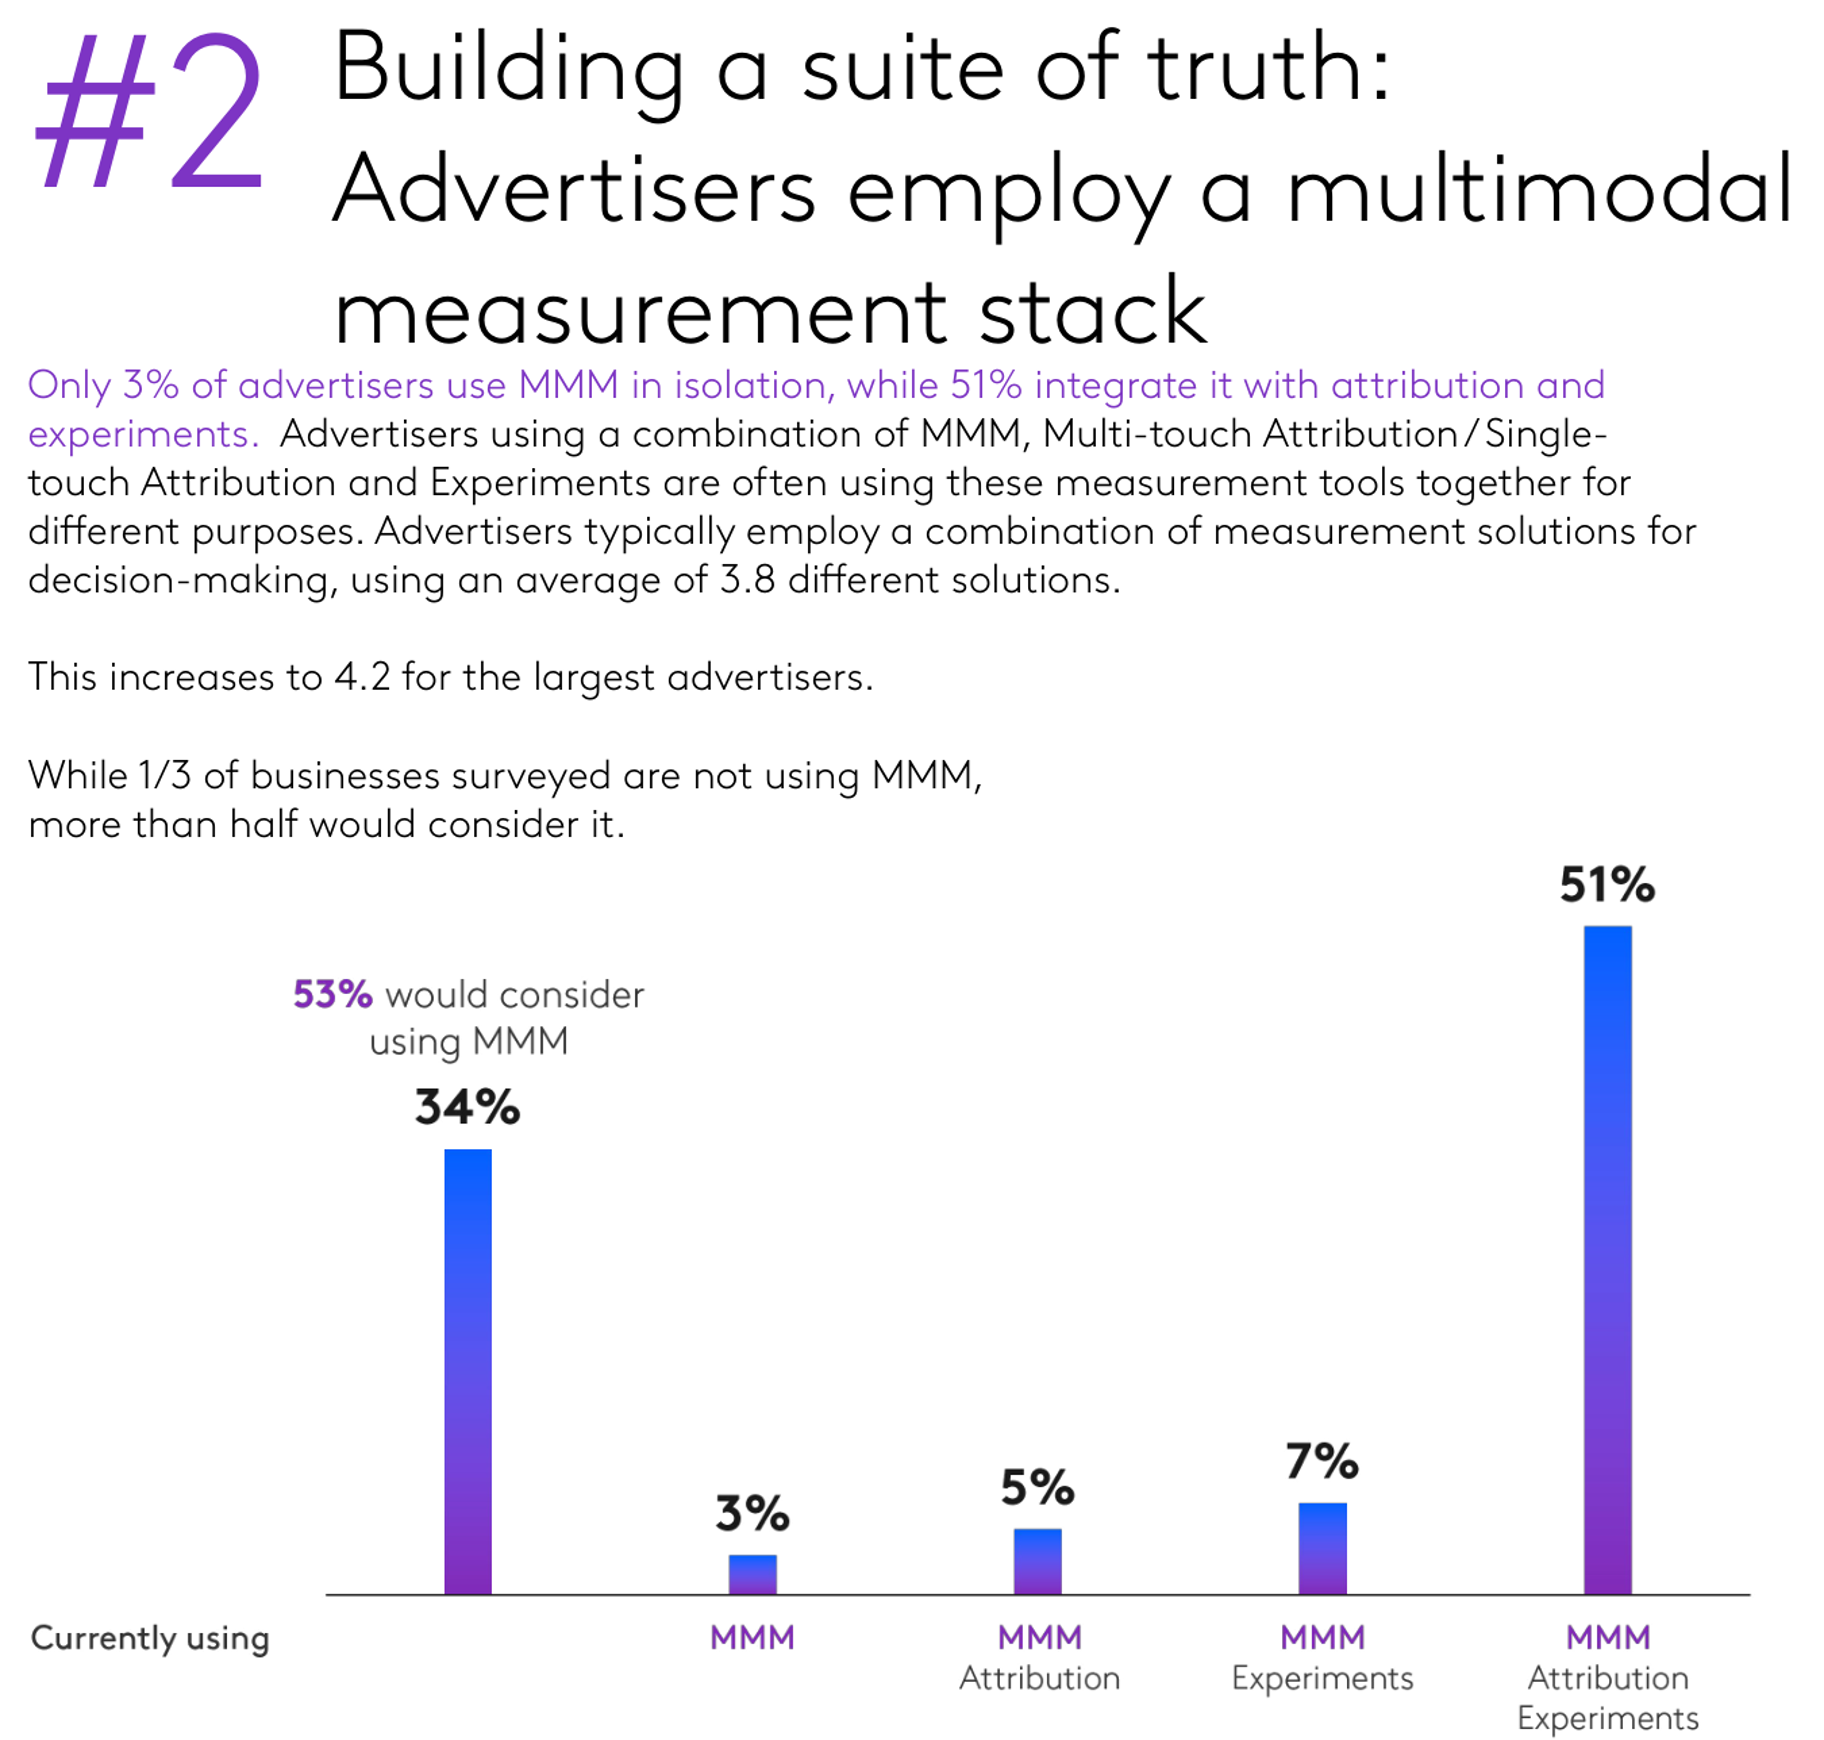
Marketing Mix Models
Marketing Mix Models
The “marketing mix” consists of the 4 P’s
- E.g. product line, length and features; price & promotions; advertising, PR, social media and other marcoms; retail distribution breadth, intensity and quality
A “marketing mix model” (MMM) relates sales to marketing mix variables
    - Idea goes back to the 1950s
    - E.g., suppose we increase price & ads at the same time
    - Or, suppose ads increased demand, and then inventory-based systems raised prices
    - When possible, MMM should include competitor variables also
A “media mix model” (mMM) relates sales to ads/marcom channels
- MMM and mMM share many models and techniques
MMM goal is to evaluate past marketing efforts, and better inform future efforts
MMM components
MMM analyzes aggregate data, usually 3-5 years of weekly or monthly intervals, usually across a panel of geos (e.g., states, counties, CMSAs)
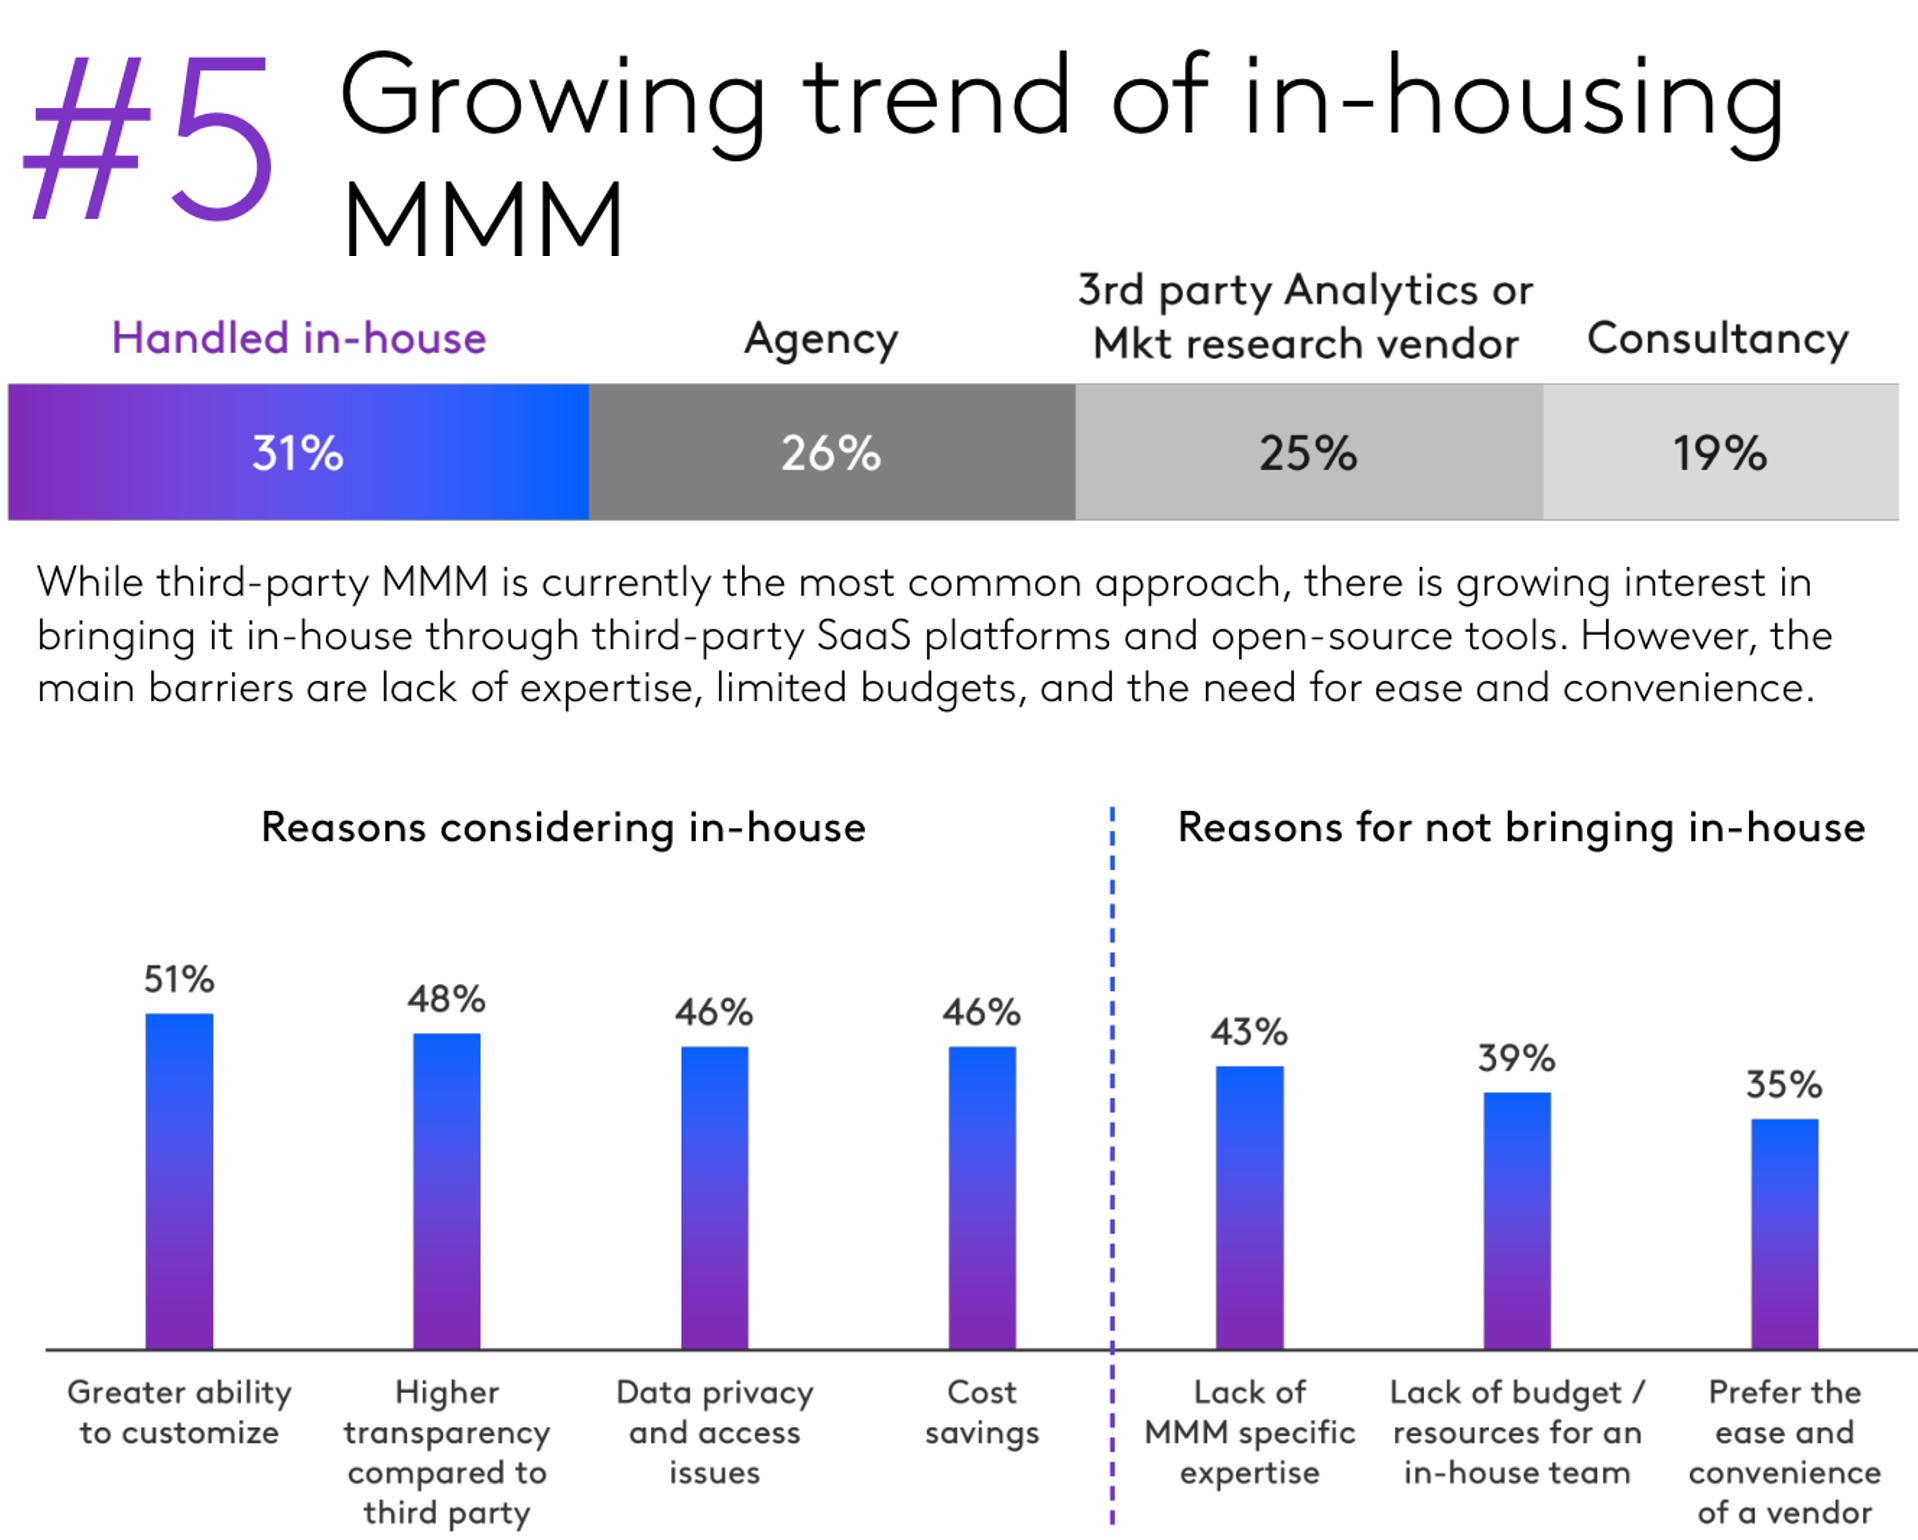
- Aggregate data are privacy-compliant & often do not require platform participation; helps explain MMM comeback
Predictors include ad spending/exposures by ad type; outcomes measure sales, volume or revenue
- Spending data is nearly always available. Exposures can be better if measured accurately
MMM usually controls for (a) trends, (b) seasonality, (c) macroeconomic factors, (d) known demand shifters, (e) saturation, (f) carryover
- Sometimes accounts for interactions between push/pull channels as well
Analysts use data to select model specifications under these constraints. Estimation can be frequentist, Bayesian, ML-based
Outputs include ad elasticities, ROAS measures, and budget reallocation
MMM parameters can be interpreted causally if and only if adspend data are generated with a randomization strategy built in
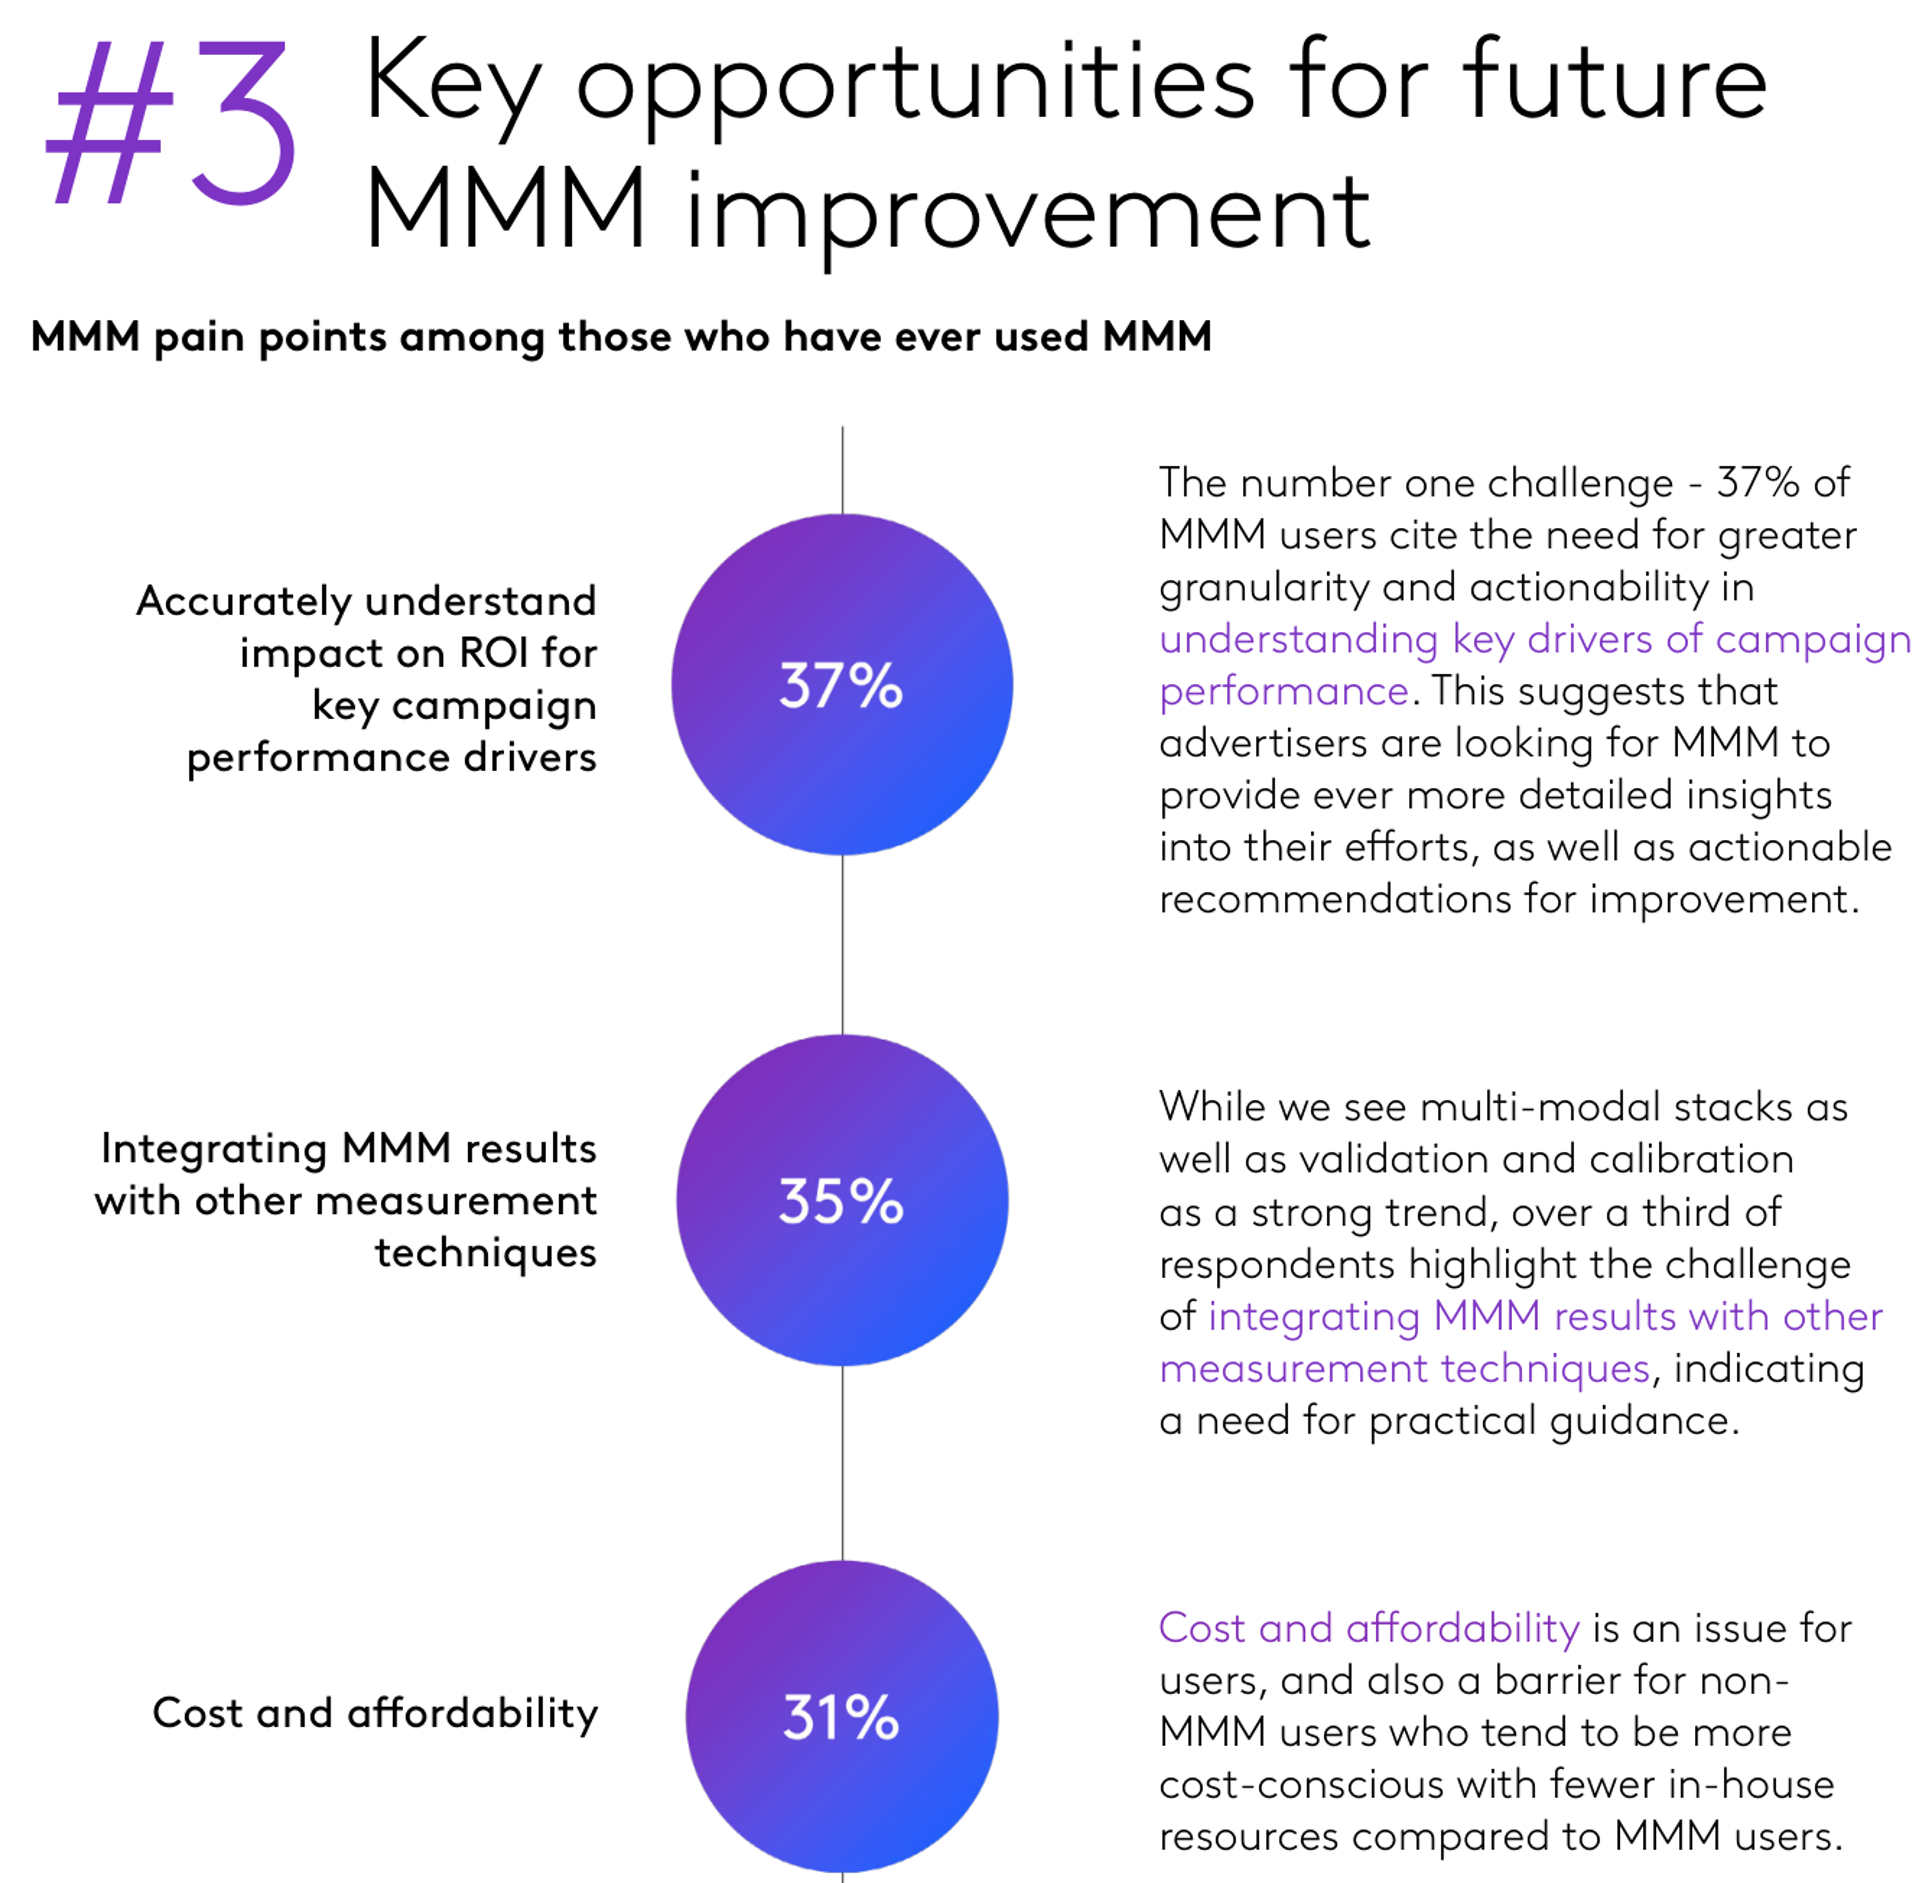
MMM Considerations
Data availability, accuracy, granularity and refresh rate are all critical
MMM requires sufficient variation in marketing predictors, else it cannot estimate coefficients
“Model uncertainty” : Results can be strongly sensitive to modeling choices, so we usually evaluate multiple models
MMM results are correlational without experiments or quasi-experimental identification
- Correlations can be unstable; Bayesian estimation can help regularize
- MMM results can be causal if you induce exogenous variation in ad spending
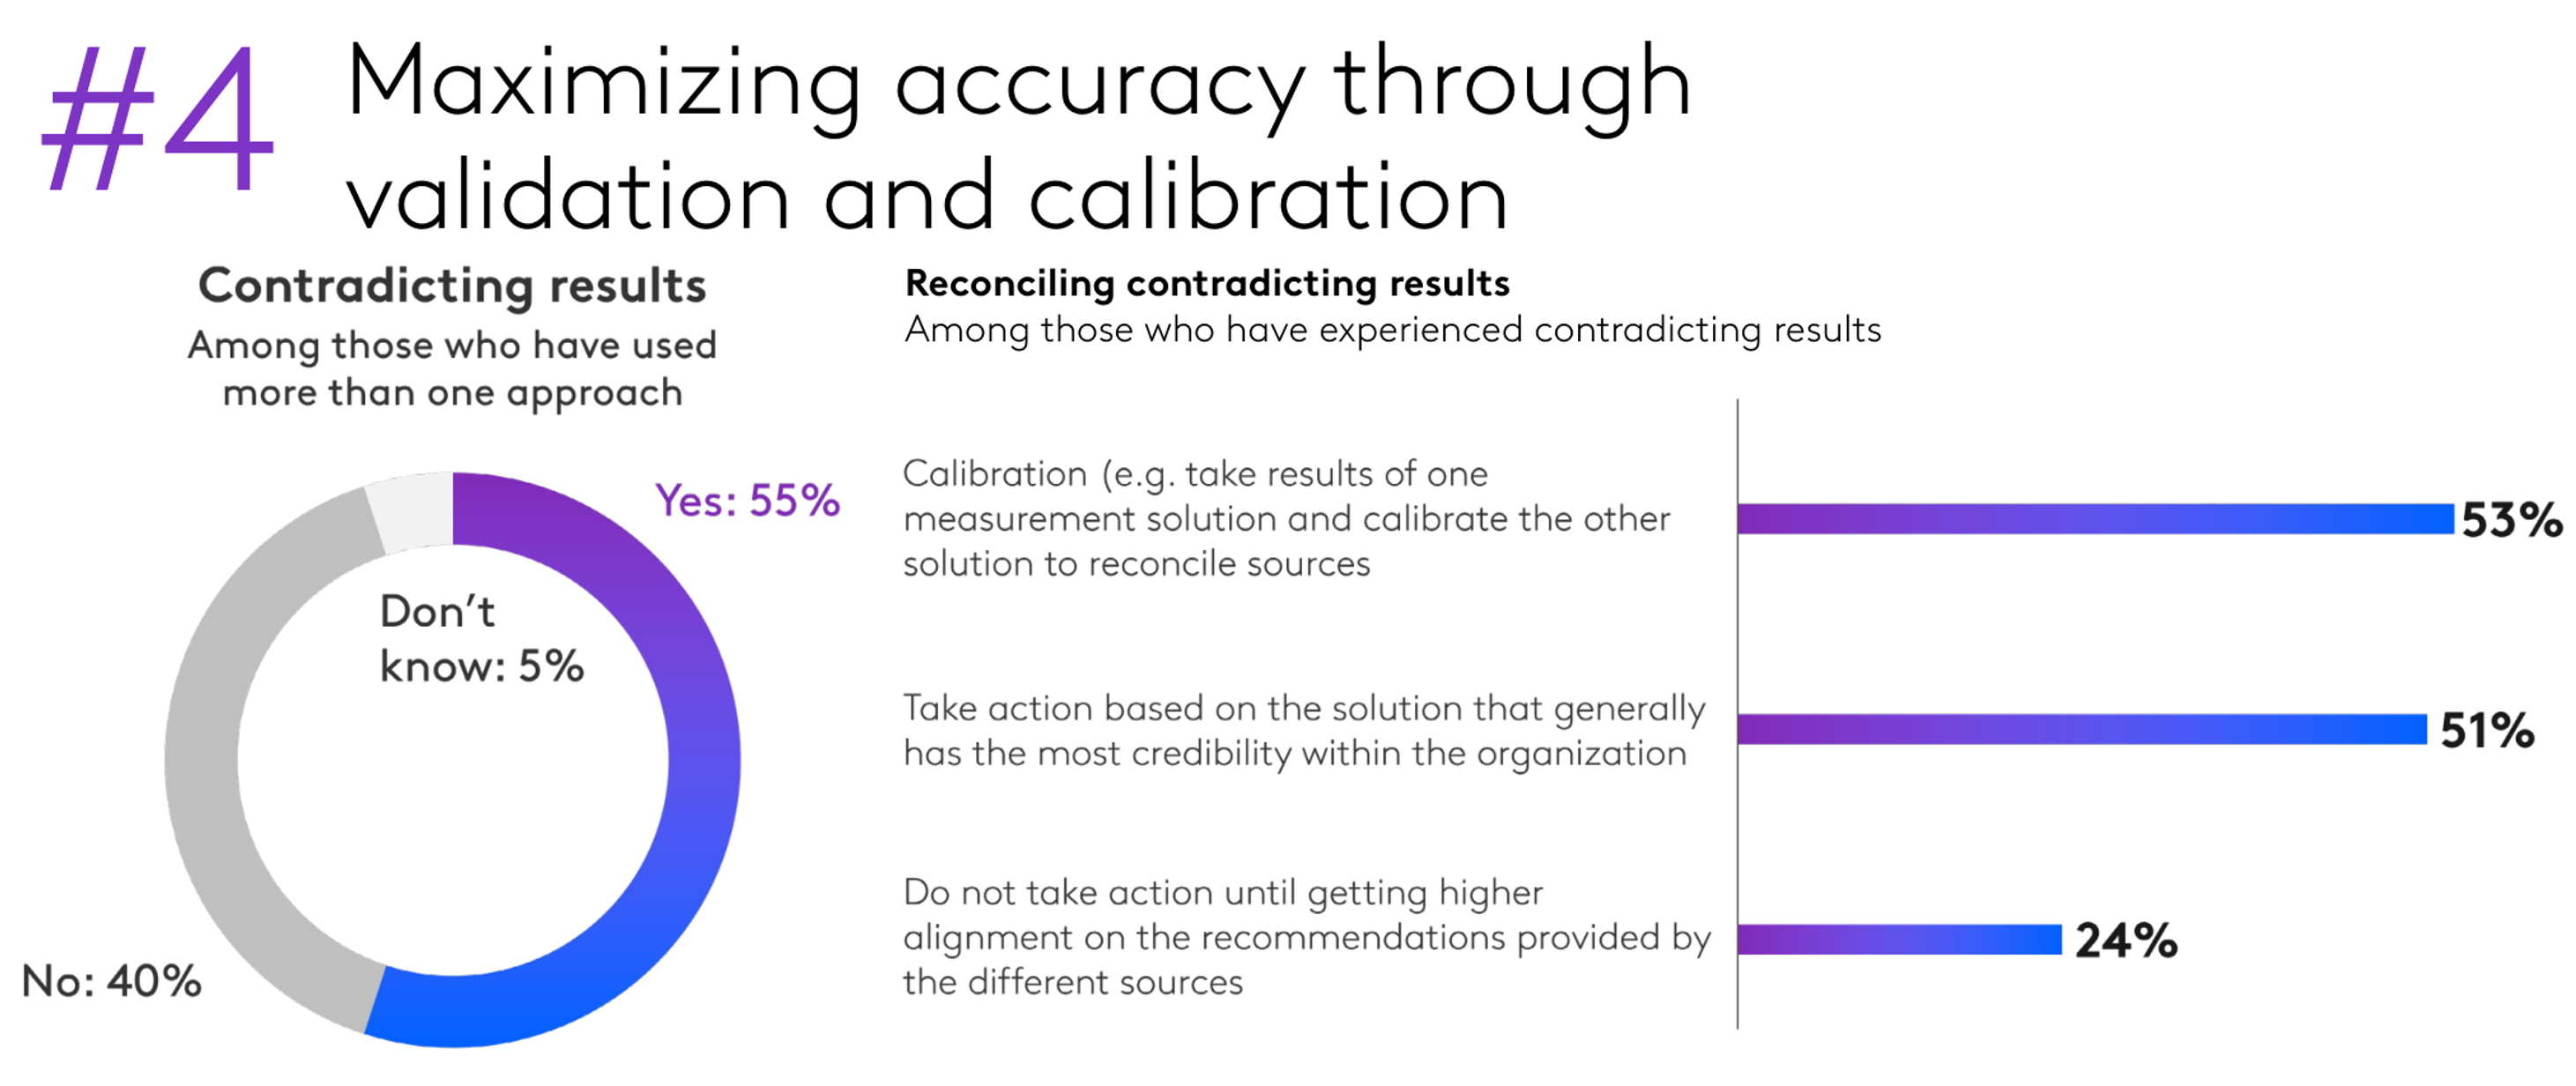
- MMM results can be calibrated using causal measurements
Adopting incremental methods is a resume headline & interesting challenge
    - Team may have a narrow view of experiments or how to act on them
    - Understanding that view is the first step toward addressing it
    - Reach up the org chart, you will need leadership onboard
Correlational + Incremental > Either alone
    - What incrementality might be valuable? What's our hardest challenge?
    - What quasi-experimental measurement opportunities exist?
    - Can we estimate the relationship between incremental and correlational KPIs?
Going-dark design
    - Turn off ads in (truly) random 5% of places/times; nominally free, though arguably costly if it foregoes some sales
    - How do going-dark sales data compare to correlational model's predicted sales?
    - Can we improve the model & motivate more informative experiments?
If structural incentives misalign, consider a new role
    - You can't reform a culture without being in the right position
    - Life is short, do something meaningful
Takeaways
Fundamental Problem of Causal Inference: We can’t observe all data needed to optimize actions. This is a missing-data problem, not a modeling problem.
- Common remedies: Experiments, Quasi-experiments, Correlations, Triangulate; Ignore
Experiments are the gold standard, but are costly and challenging to design, implement and act on
Ad effects are subtle but that does not imply unprofitable. Measurement is challenging but required to optimize profits