Customer Data Visualizations

MGT 100 Week 1

Kenneth C. Wilbur and Daniel Yavorsky

Data Visualizations (Viz)

  • “The greatest value of a picture is when it forces us to notice what we never expected to see.”

        - Boxplot Inventor John Tukey
        - Great visualizations raise new questions          

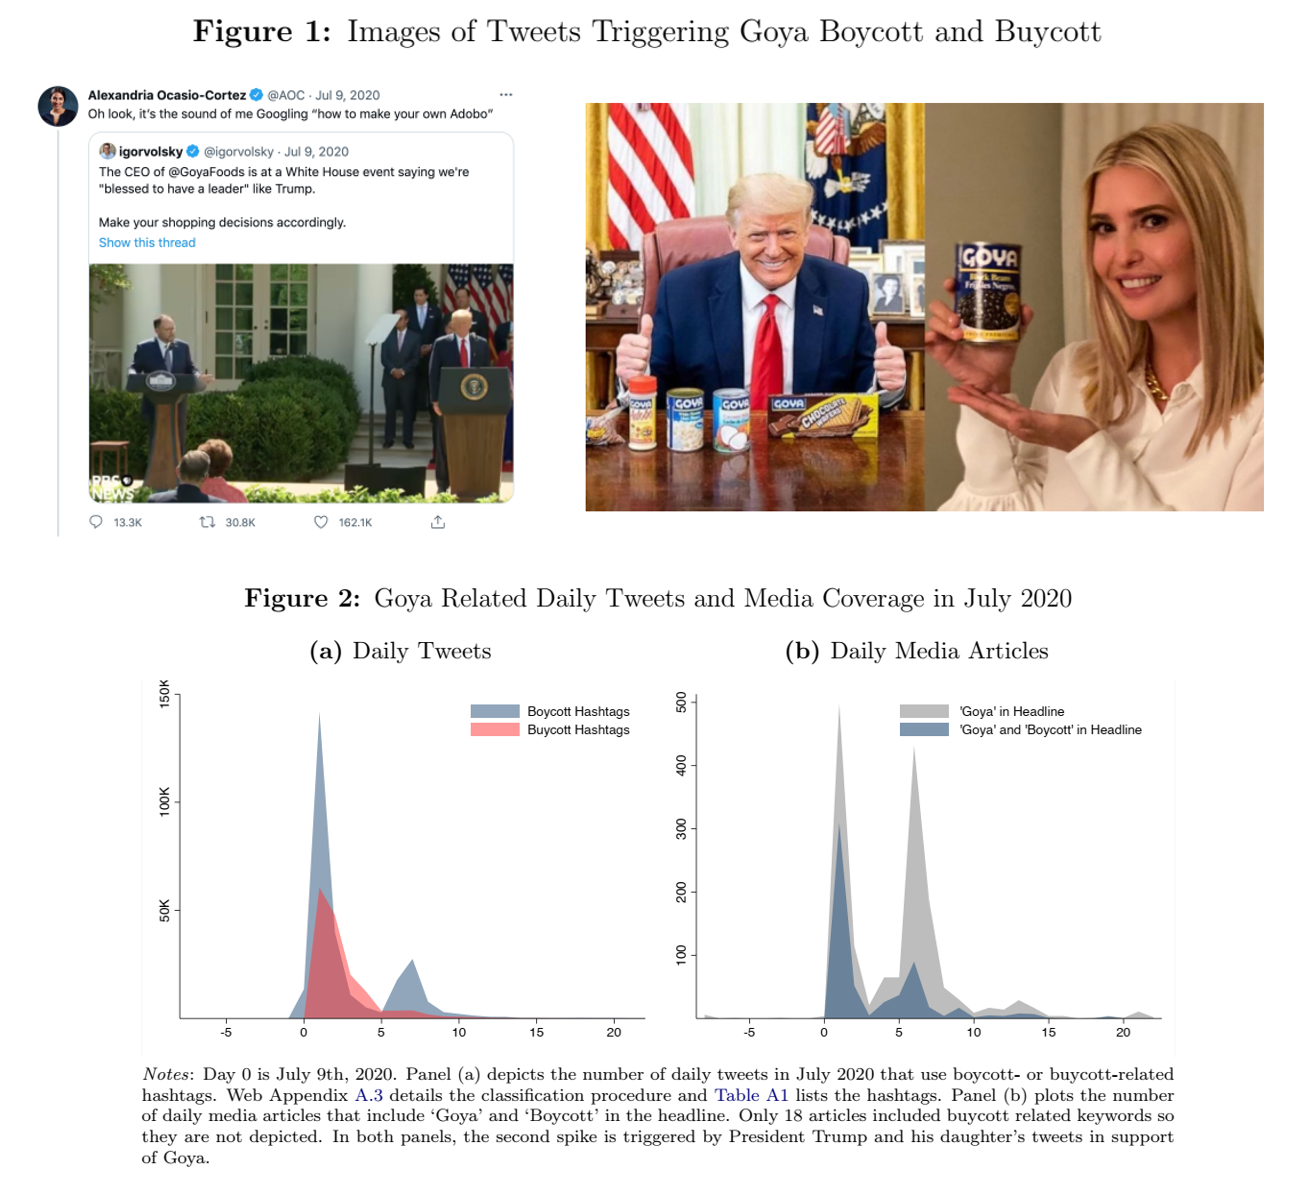
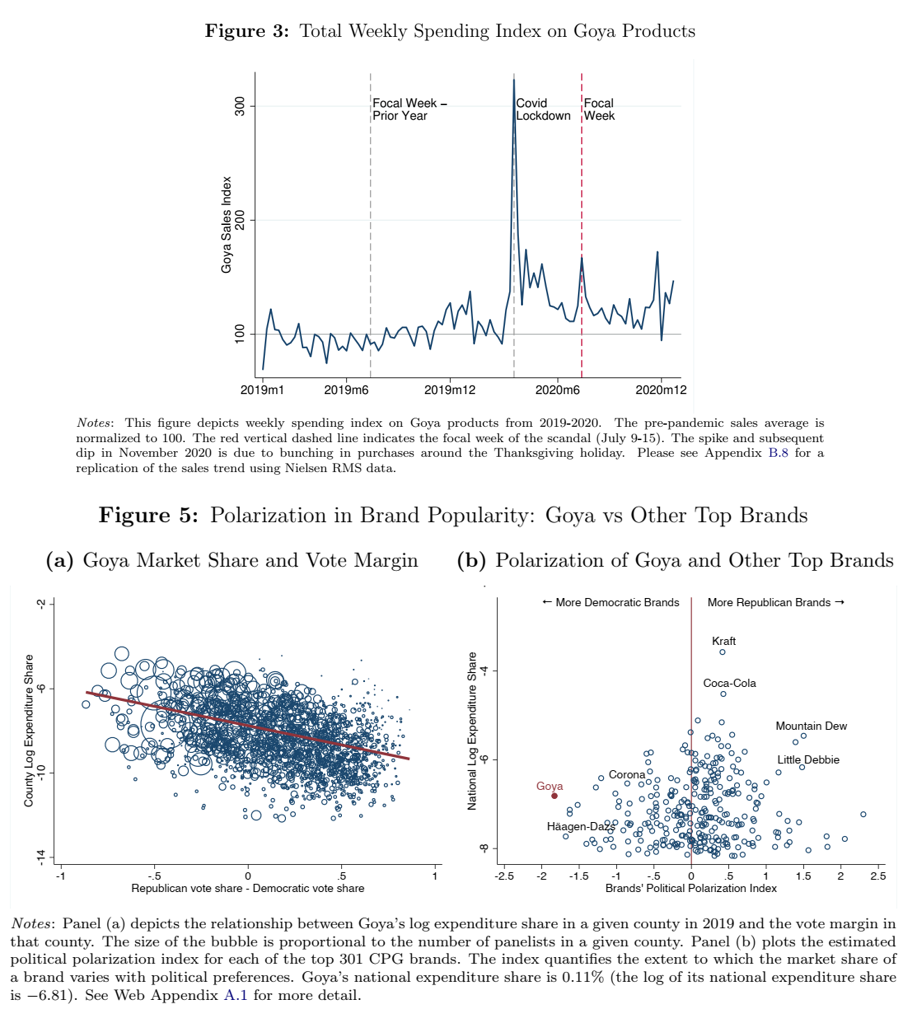
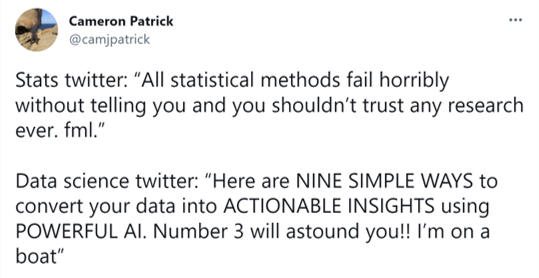
When Elon bought Twitter

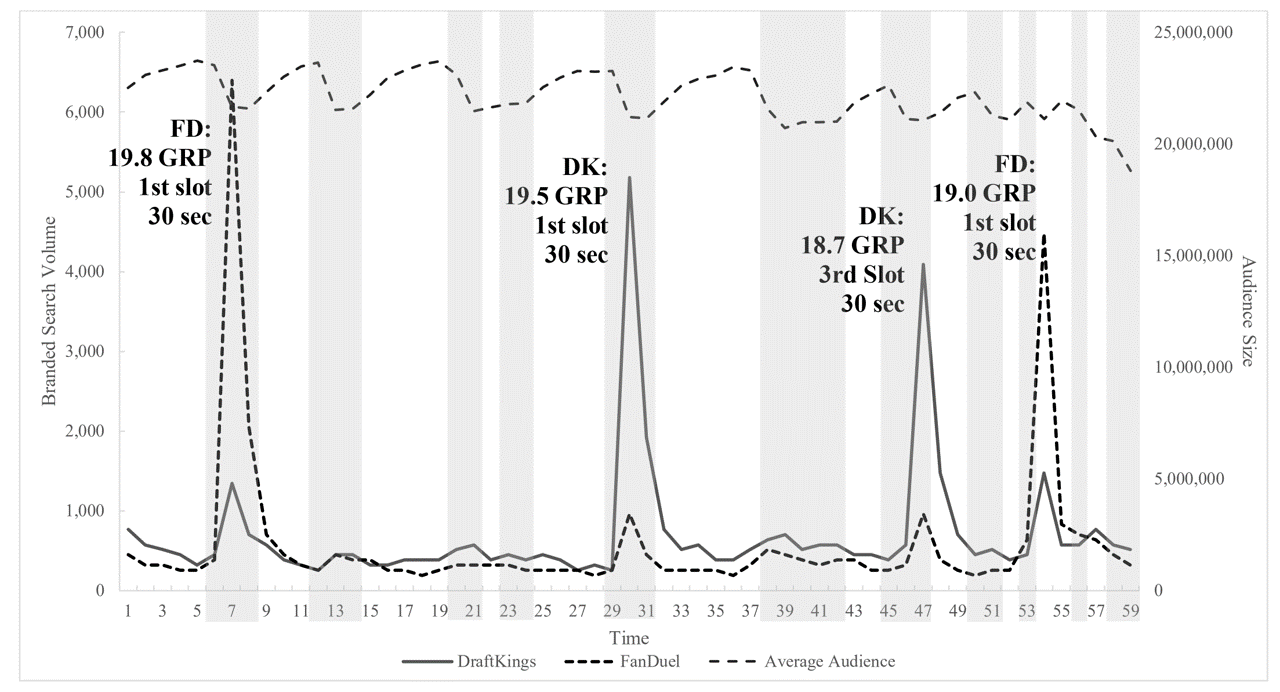
DraftKings, FanDuel Searches during an NFL Game, 9-10 P.M.

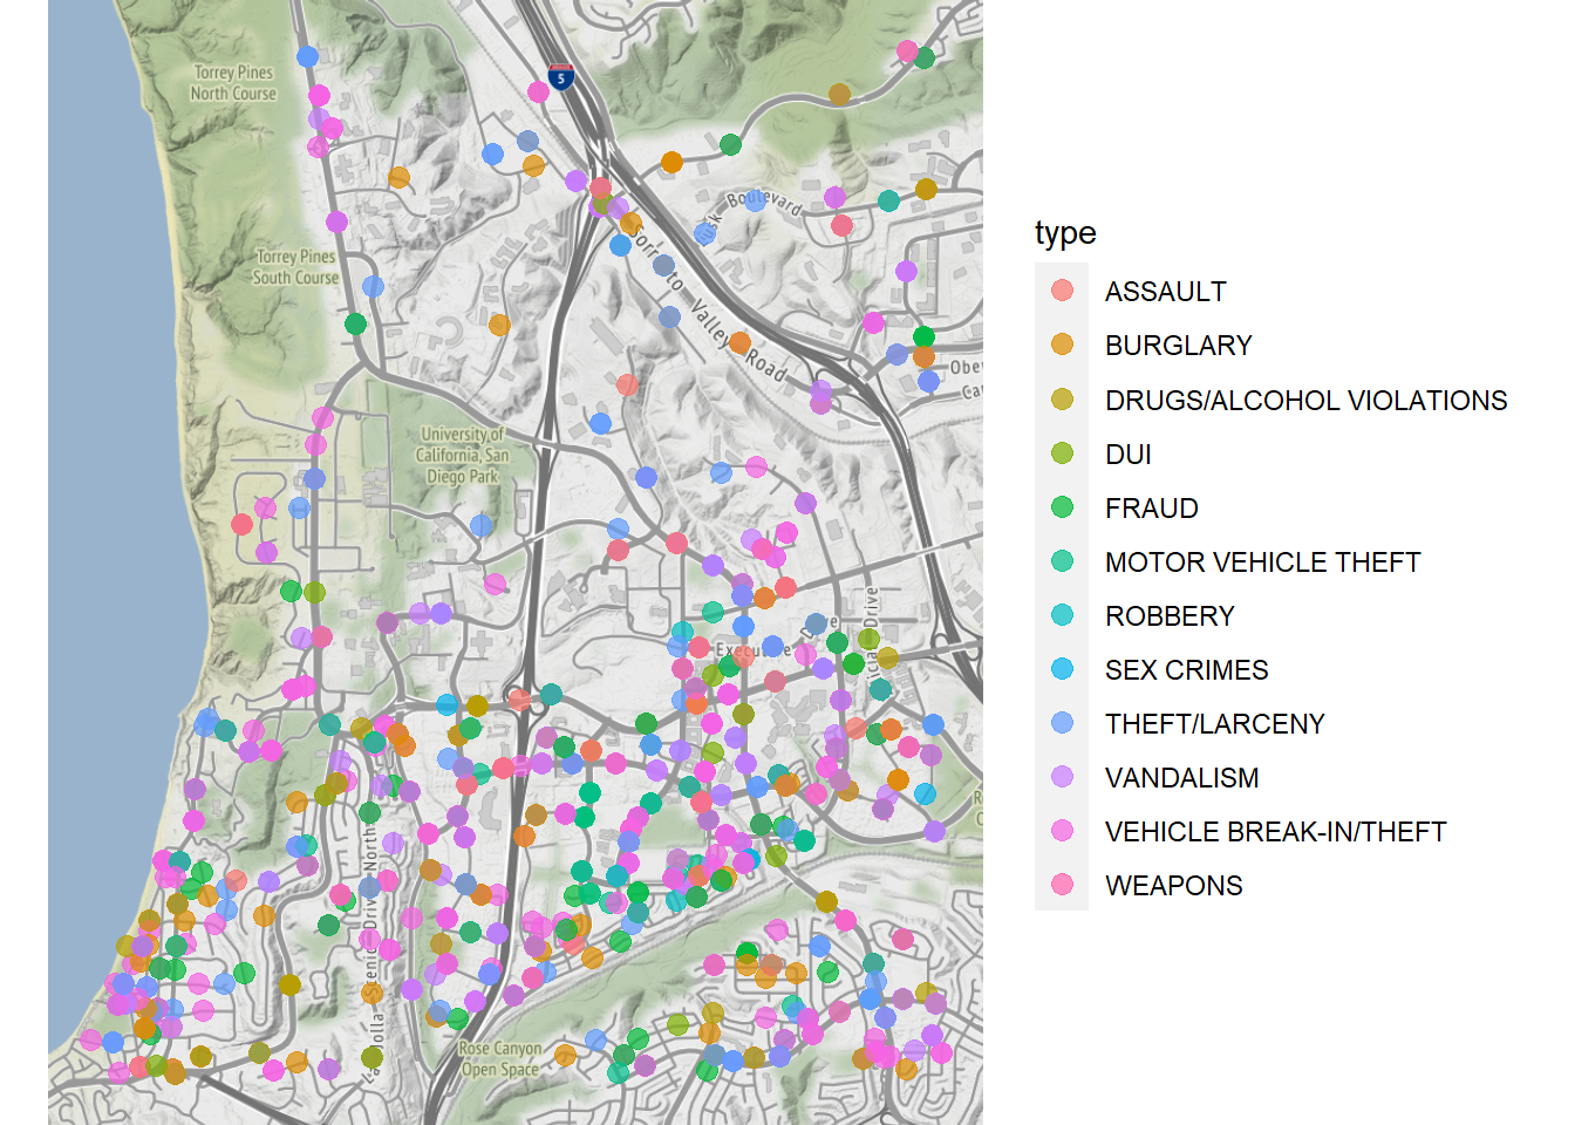
SDPD Crime Reports Near UCSD

Viz build trust and understanding

  • Viz are lingua franca across disciplines
  • Eyeballs can interpret pictures quickly
  • Easily replicated -> more easily trusted
  • Understandable to managers
  • Can detect unknown errors
  • Best when they raise deeper questions

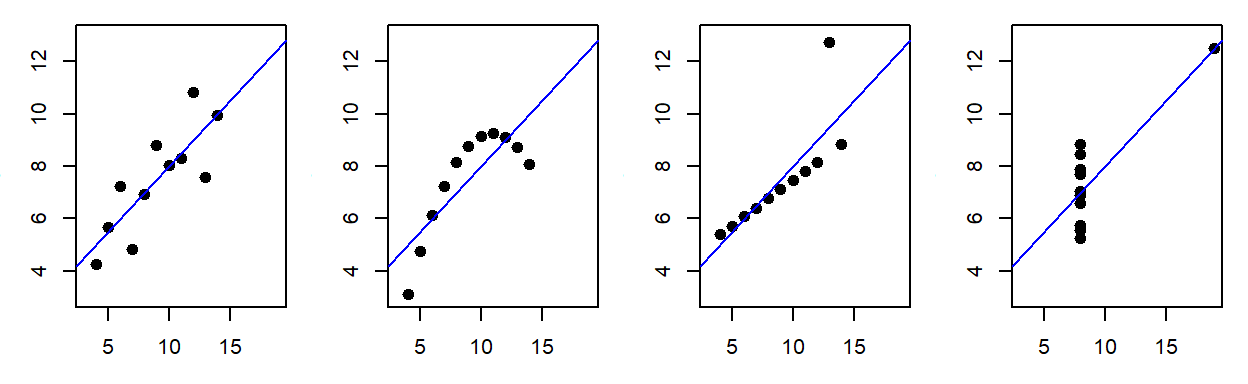
Why you visualize data first

  • 4 Datasets, Same \(\hat{\beta}^{OLS}\)

Customer Analytics

Customer

  • Receives good or service in exchange for payment (money, time, attention)
  • Has agency: Can say “no”
  • “The purpose of business is to create and keep a customer.”
    -Drucker

Analytics

  • Using data to improve decisions
  • Started by Charles Taylor in the 1880s
  • Popularized by Moneyball (2011)
  • Measurement, Heuristics, Graphics, Models, Predictions, Automation, …
  • Can be deceptively difficult

First Law of Customer Analytics

  • No Customers, No Business

  • No Customers ->
    No Revenue ->
    No Profit ->
    No Business

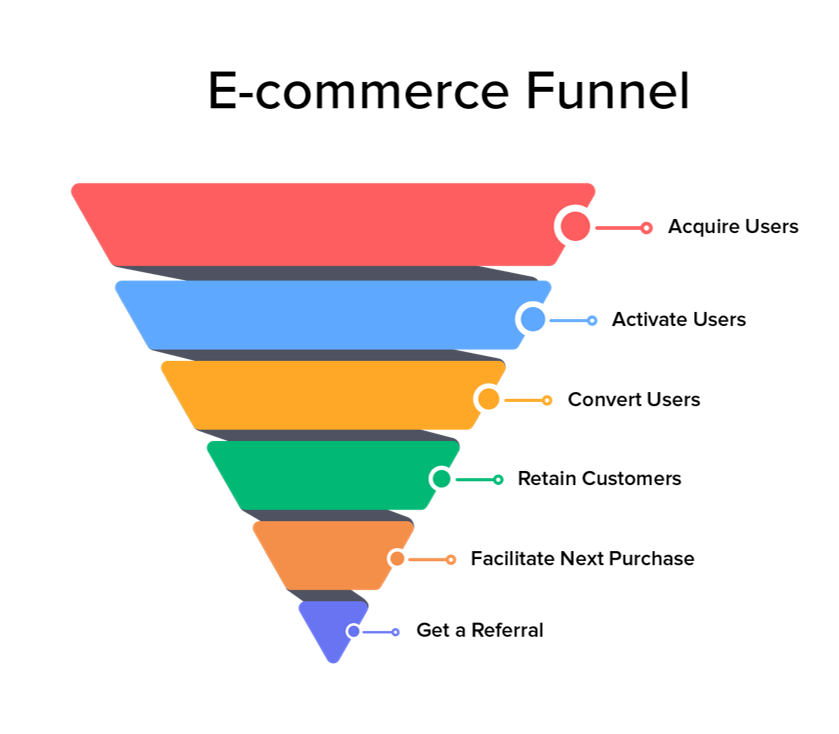
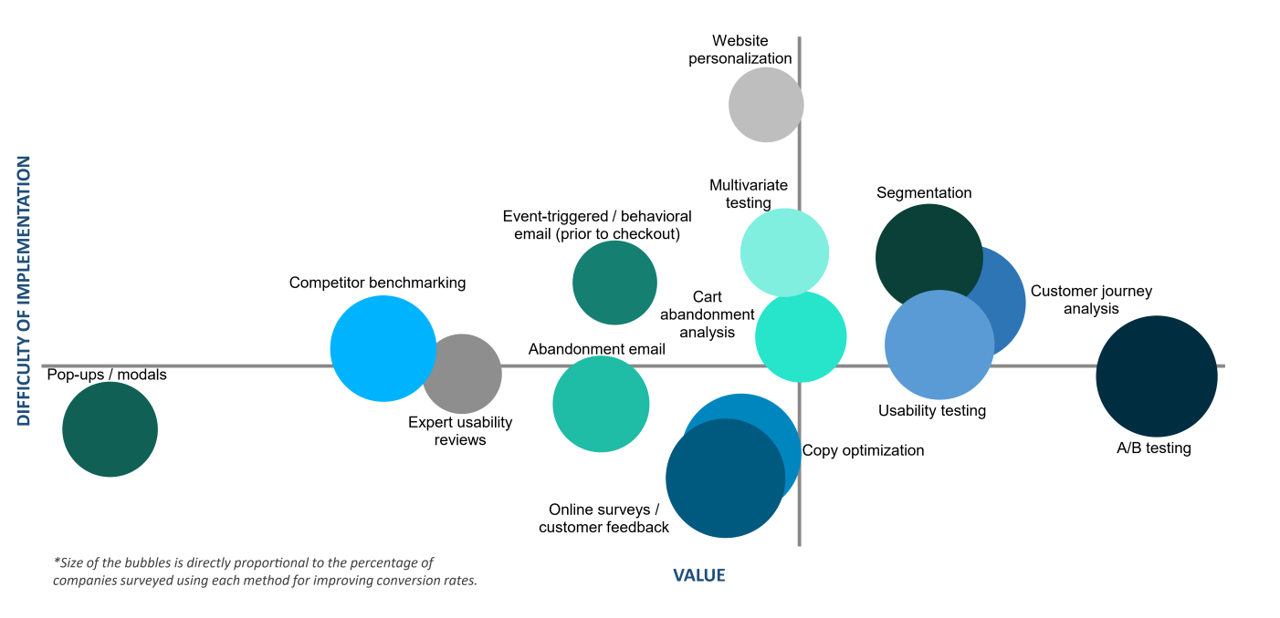
E-commerce Analytics

Customer Data

Customer Data

  • Customer data show how customers and consumers learn, feel, behave and use products and services

  • Customer data increasingly drives marketing, but implementation varies widely

How can we use customer data?

  • Customer relationship management: Acquire, develop, retain and “fire” customers
  • Marketing mix: Improve product offerings, prices, promotion, distribution
  • Understand customer heterogeneity for targeting, personalization, recommendations, product development…
  • Privacy and security, e.g. misuse, theft, regulatory compliance

How to evaluate customer data

  • Accurate : The data are what we think they are
  • Representative : The data reflect the relevant customer population as a whole
  • Private : The data do no harm & comply with laws & ethics
  • Relevant: The right data for the decision at hand
  • Complete : Missingness causes problems

Example: Nielsen

CONSUMER PANEL DATA

      - The Consumer Panel Data include longitudinal data beginning in 2004 with annual updates. These data track a panel of 40,000–60,000 US households and their purchases of fast-moving consumer goods from a wide range of retail outlets across all US markets. 

RETAIL SCANNER DATA

      - Retail Scanner Data consist of weekly pricing, volume, and store environment information generated by point-of-sale systems from more than 90 participating retail chains across all US markets. Data begin in 2006 and include annual updates. 

Customer Data: Guiding Principle

  • Start simple. Complexify slowly. Why?

  • Never assume data are correct, clean, complete or as described.

      - It's impossible to certify an absence of problems
      - Most commercial datasets have issues
      - Issues often detected months after project starts
      - ~70-90% of data scientist time spent checking and cleaning data
      - Credibility is hard to gain, easy to lose

Using Customer Data for Customer Analytics

How do we “do” customer analytics?

  • Decide what we want to do & how to judge performance
  • Collect, wrangle, clean & verify relevant data
  • Analyze data
  • Communicate analyses and recommendations
  • Make decisions
  • Implement data-driven decisions
  • Retrospectively evaluate and improve
  • Repeat
  • …Once you have a stable process, automate carefully & monitor

Challenges: Executives

  • May be territorial, or incentivized to be
  • May worry that analytics will constrain or replace them
  • May think data == magic
  • May prefer hunches or misunderstand uncertainty

Challenges: Analysts

  • Expensive
  • Hard to find
  • Not always current
  • Not always interested in business

Challenges: Cultural

  • Do analytics make or justify decisions?
  • High- or low-trust environment? Tolerance for uncertainty?
  • Do messengers get rewarded or shot?
  • Are data available and integrated?
  • Do teams work together or compete?

Signs of a great analytics org

  • C-level champion(s), i.e. C{E,A,F,M,O}O
  • Centralized team regulates data, arch., standards & tools
  • Decentralized analysts collaborate with execs
  • Analytics career tracks are well established
  • Careful in-housing/outsourcing decisions about analytics
  • Good examples?

Analytics truisms

  • Analytics matters more in B2C than B2B (why?)

  • Selection effects are usually large

      treatment effects are usually small
  • Demographics don’t predict behavior very well

  • Agencies lie about data sometimes

  • You have limited credibility. You may only get a few strikes

  • “If it’s written in LaTeX, it’s probably correct”

Our Class

Course Design Principles

  • Survey the field with pointers for deeper learning

  • Experiential learning:
    “You don’t understand it until you code it’’

  • Free materials

  • Communication

    1. Website for syllabus, slides, scripts, data, readings
    2. Canvas for groups, deliverables & grades
    3. Piazza for all asynchronous interaction. No email
    4. After class, break or office hours for live discussions
  • Course site & schedule

Tips to get an A

  • Read the syllabus

  • Budget 5-10 hours/week

  • Between classes:

    1. Do homework solo
    2. Check homework with group, resolve differences
    3. Monitor Piazza 
    4. Read for the next class
    5. Fix a time/location, repeat 8 times 
  • Contribute in class

Integrity

  • We assign attending students to study groups in week 2

    - First homework is individual
  • It is OK to share answers and scripts within groups,
    but not between groups

    - Exams are individual, offline, & based on homeworks
    - You are individually responsible for all deliverables
    - Script sharing is detectable, please be careful!
    - All grades are relative: Tell us if you observe integrity violations
  • We encourage you to use Gen AI; we use it too

  • Please enter your intentions for this class on Canvas.
    How will you measure your effort?

Vocab

Common language helps communication

Customer level

  • Core need: identifiable problem a customer wants to solve. Could be functional, emotional, social, profit-motivated, etc. Related: desire, want, pain point

  • Core benefit: Customer’s desired outcome of a purchase. E.g., commuters need to get to school, not necessarily cars

  • Consumer: Entity that experiences the core benefit

  • Customer: Entity that purchases and pays

Product level

  • Product/service/experience: Distinct offering that provides the core benefit

  • Features: Aspects of a product that provide additional tangible or intangible benefits

  • Contribution margin: Price — marginal cost

  • Competitor: Any paid or free alternative that addresses the core need. E.g., commute by bike, walk, bus, trolley, Uber, scooter, skateboard; work from home

Market level

  • Market: A group of potential customers with the same core need

  • Segment: Distinct subgroup of similar customers

  • Targeting: Which segment(s) a firm tries to serve

  • Positioning: Specification of product features to suit targeted segments

  • Marketing: Practice of meeting customer needs profitably How to be good at marketing

Legacy Terms

  • 3/4/5 C’s: Customer, Competitor, Company;
    Context; Complementors

  • 4/…/10 P’s:
    Price, Product, Promotion, Place AKA distribution

Coding & Script

Coding errors

  • “The good news about computers is that they do what you tell them to do. The bad news is that they do what you tell them to do.”

  • Conjecture:
    (debugging difficulty) is exponential in (lines of code)

  • We can code fast or slow

Coding Habits

  • Good habit: Test chunks as you code

  • Test = Check that output matches expectation

  • “Go slow to go fast”

Pipe |>

  • y <- f(g(x)) is the same as

  • y <- x |>

    g |>

    f

  • Why?

  • Old pipe was %>%

Today’s script

  • Install/update R and Rstudio
  • Posit.Cloud
  • Data Import/export
  • Data manipulation, summarization
  • 5 verbs: Summarize, select, filter, arrange, mutate, group_by
  • Univariate statistics
  • Univariate plots
  • Bivariate statistics
  • Bivariate plots

Wrapping up

Homework

  • Face photo, coding assignment

Recap

  • Customer analytics : Using customer data to improve decisions

  • Marketing : Meeting customer needs profitably
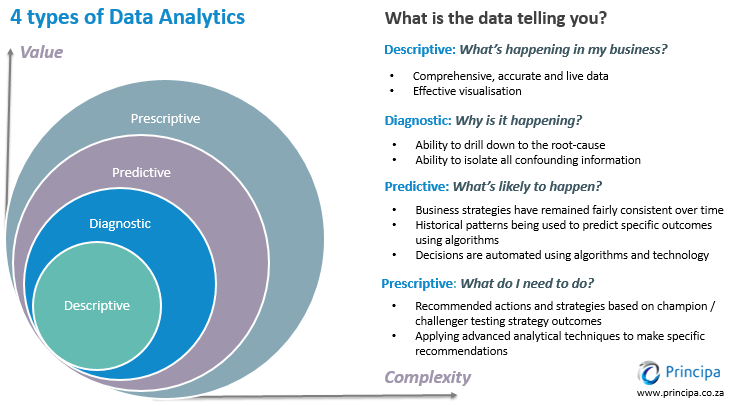
  • Analytics types:
    Descriptive, Diagnostic, Predictive, Prescriptive

  • Summarize, select, filter, arrange, mutate, group_by

  • Good data are Representative, Unbiased, Private, Relevant, Complete

  • Data Viz are best way to start in customer analytics

Going further