Visualization, Intro
MGT 100 Week 1

Data Visualizations (Viz)
“The greatest value of a picture is when it forces us to notice what we never expected to see.”
    - Boxplot Inventor John Tukey
    - Great visualizations raise new questions
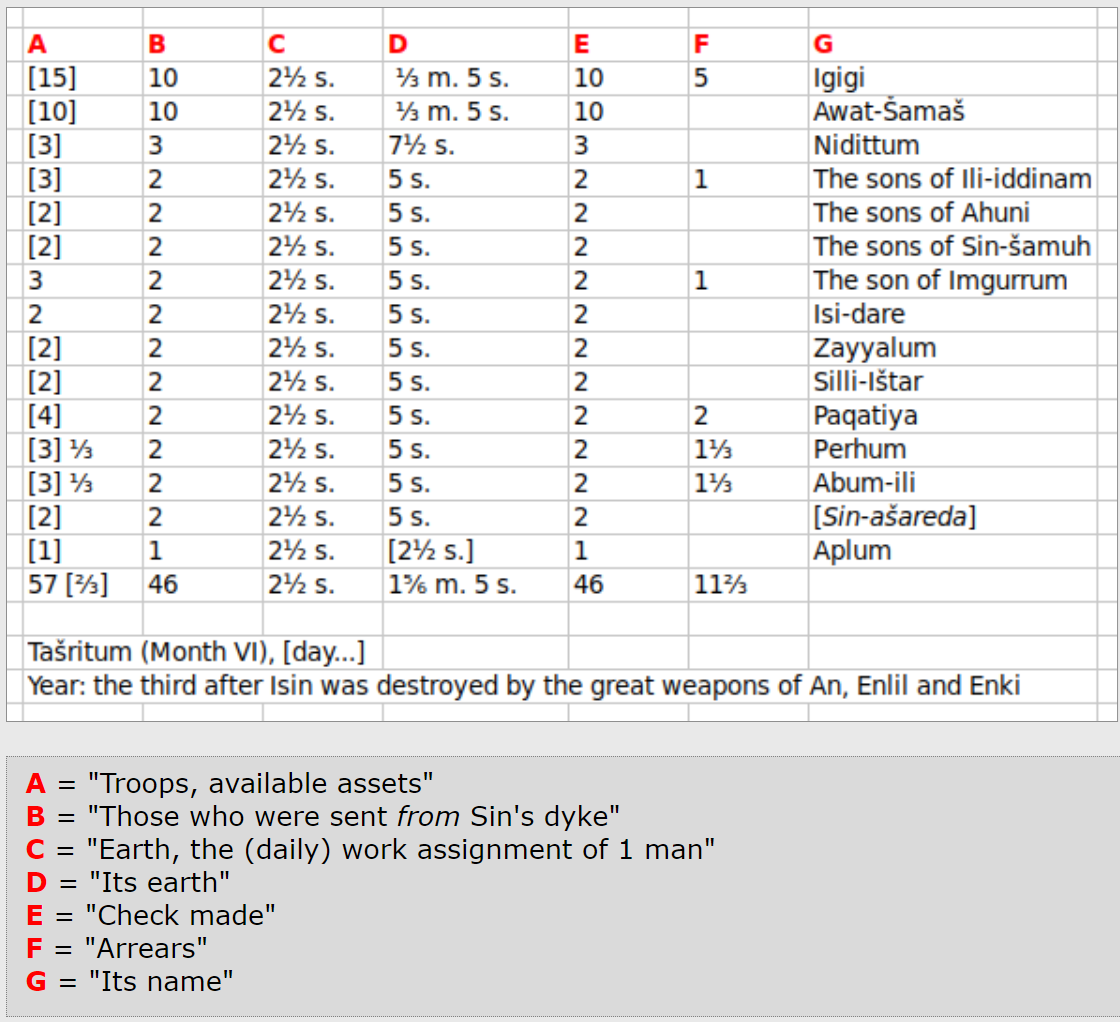
Data Viz are older than 0

Translated
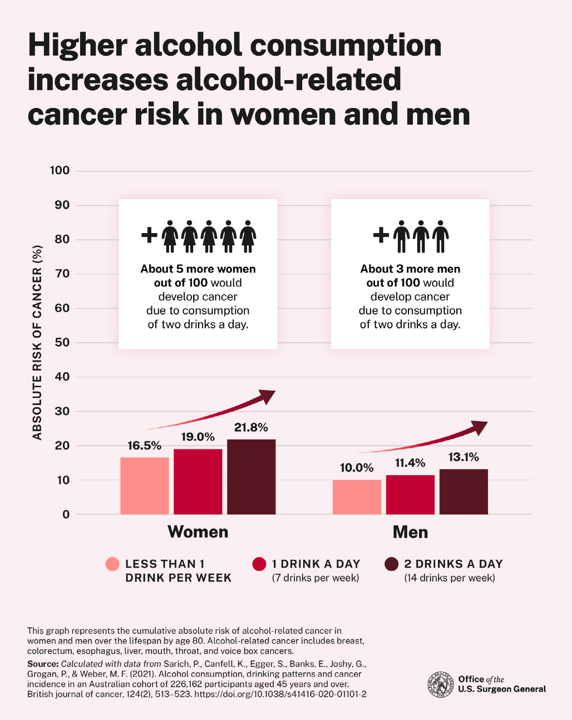
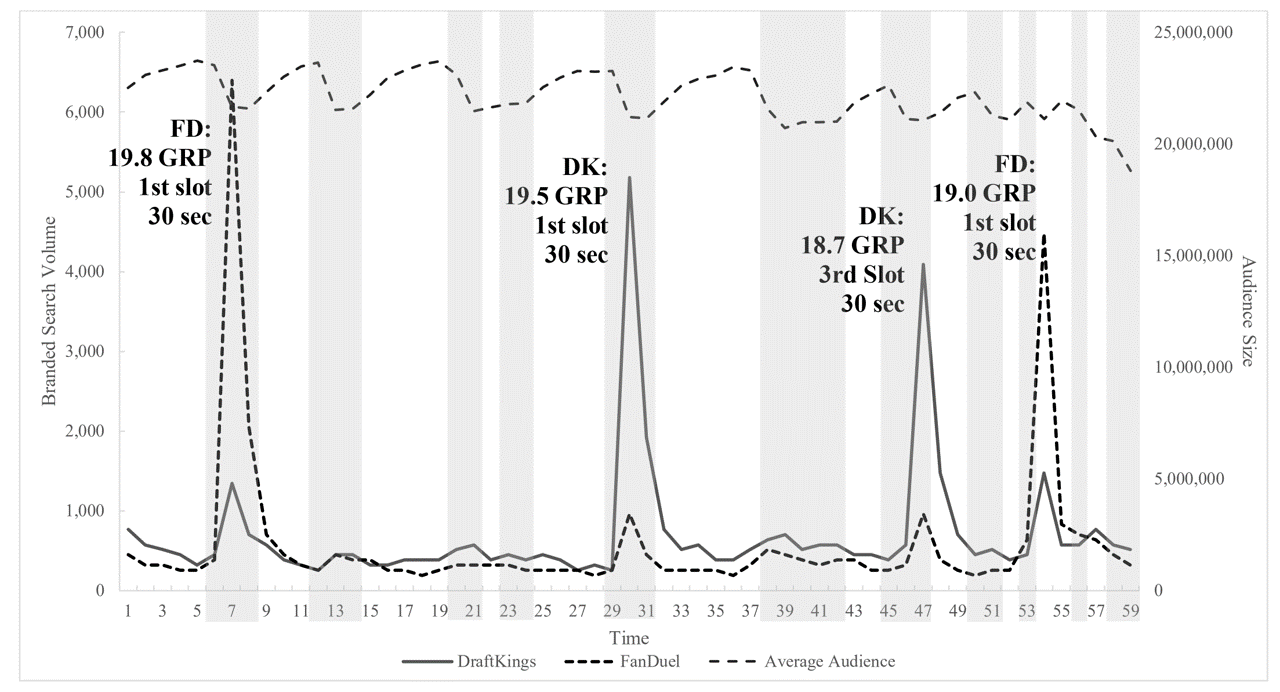
SDPD Crime Reports Near UCSD
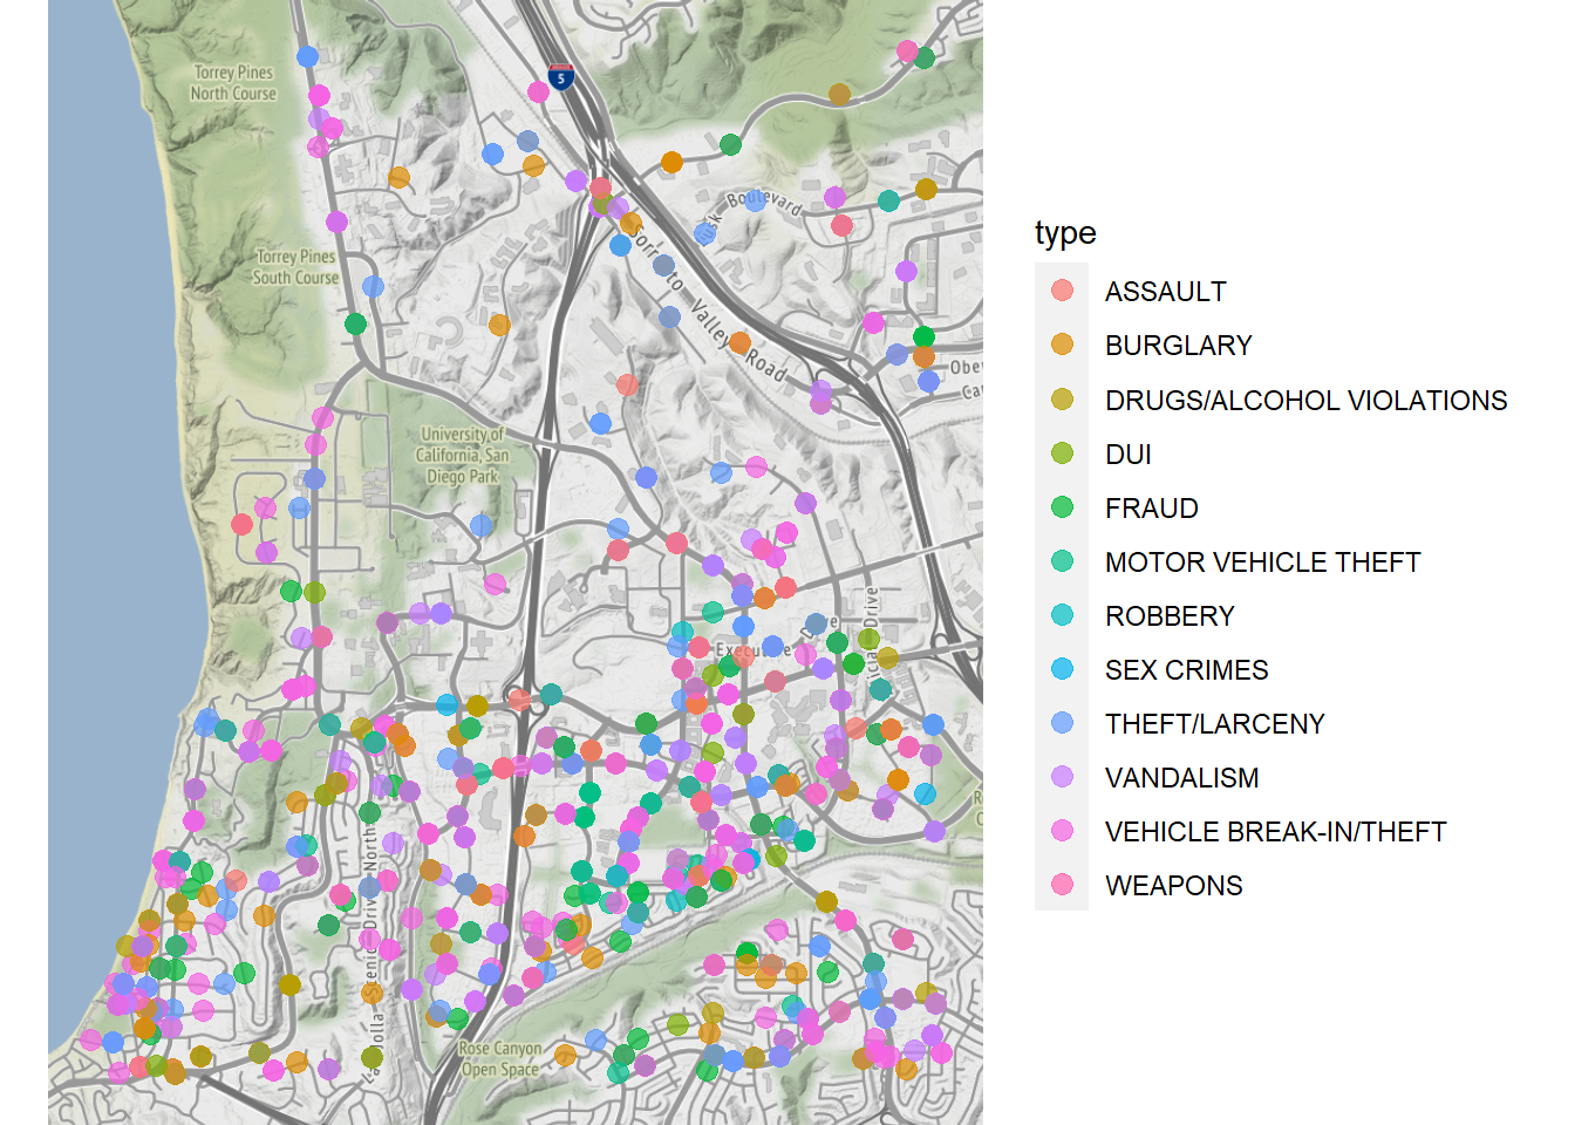
- When is data zero vs. missing? Provenance is key
- What kind of decisions could this inform?
Data Provenance
describes people, entities, and activities involved in producing, compiling, transforming & sharing data
- Verifiability requires source data & cleaning scriptsCrucial in determining quality, reliability, trustworthiness
- Investigating provenance requires and deepens domain expertise
- Typically turns up unexpected information, and sometimes errors
When can you trust provenance information?
  - Best to treat provenance as hypotheses to be verified in the data
  - Usually, provenance descriptions are missing or imperfect
  - Financial info is most likely to be accurate due (accounting, auditing)
  - Considerations: Consent; Privacy; Missingness; Permissible uses
  - Sometimes, provenance descriptions are marketing documents
Questions to ask
Data Origin, Measures, Quality, Verifiability
  -   How were the data produced?
  -   Who collected it, when and why?
  -   How is each variable measured? (surveys, APIs, sensors, etc; units)
  -   Is there a data dictionary or changelog?
  -   How can I verify individual datapoints?
  -   Certified by any third party? Who relies on them, for what?
Processing & Transformation
  -   What cleaning or manipulation was done?
  -   Who performed it and why? Can I see their scripts?
  -   Were missing values imputed? How?
  -   How were outliers handled?
Viz can build trust, understanding
Eyeballs can interpret pictures quickly
- Human brains are great at interpreting visual patterns, predictions
- Can detect unknown errors
Understandable to managers
- Viz choices enable narrative understanding, another common brain functionViz are lingua franca across disciplines
- Easily replicated -> more easily trusted
- Trust can is a major issue in some corporate cultures
Viz succeed when they raise deeper questions
- Asking the next question indicates acceptance
- "I wonder why that is...." or "Maybe that's because..."
- Viz usualy won't settle the matter; hence, the first step
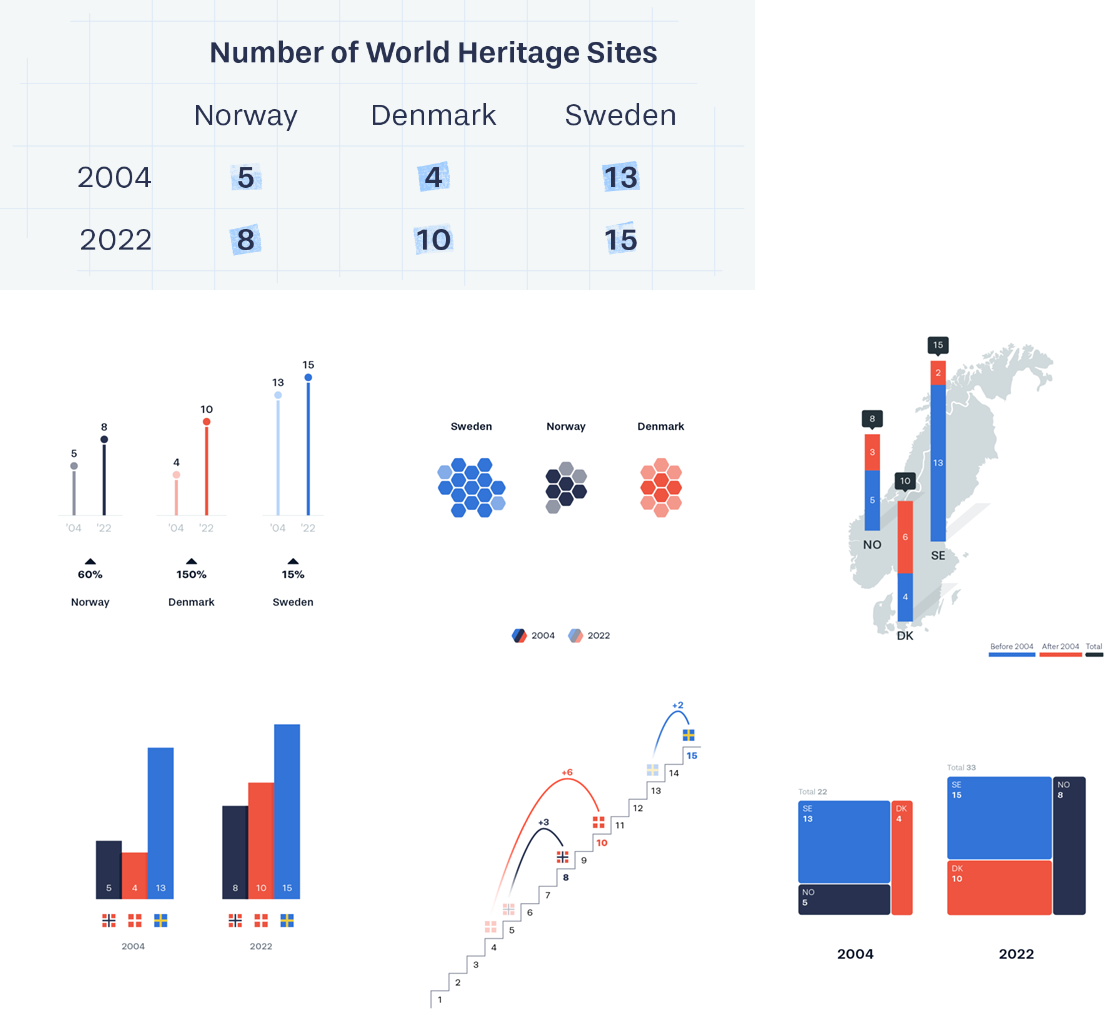
Honest Viz
Usually start axes from 0, choose scales judiciously
Show all relevant data, label accurately. Don’t edit, trim
Discretize and smoothe judiciously
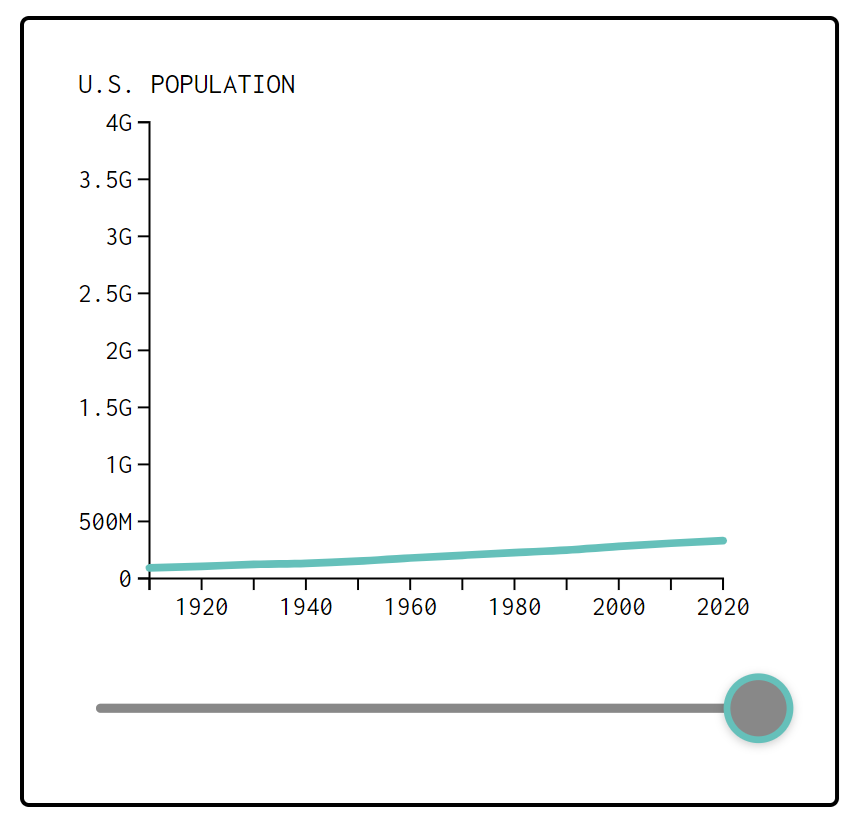
Visualize data before you analyze
- 4 Datasets, Same \(\hat{\beta}^{OLS}\), i.e. same \(\frac{x'x}{x'y}\)

Customer Analytics
Customer
- Receives good or service in exchange for payment (money, time, attention)
- Has agency: Can say “no”
- “The purpose of business is to create and keep a customer.”
-Drucker

Analytics
- Using data to improve decisions
- Started by Charles Taylor in the 1880s (mostly)
- Popularized by Moneyball (2011)
- Measurement, Heuristics, Graphics, Models, Predictions, Automation, Optimization, Personalization, …
- Can be deceptively difficult

First Law of Customer Analytics
No Customers, No Business
No Customers ->
No Revenue ->
No Profit ->
No Business
QED
Second Law of Customer Analytics
More Customers, More Profits
More Customers ->
More Revenue ->
More Profit
QED- These are empirical tendencies, not logical necessities - Individual customers can be unprofitable if (price-cost)<0Marketing Objective: Maximize Long-term Profits
  - Long-term focus mostly aligns our interest with customers
  - Goal is not only to acquire customers; also, keep and develop them
  - Sidesteps or reduces most ethical dilemmas
  - Short-run objective may profit before liability; I won't teach
Example of Great Marketing: Netflix
Consumer surplus
  - Suppose customer pays $20/month, watches 60 hours: $0.33 per entertainment hour, or $0.13/hour with ads, or less with shared accounts
  - A la carte rentals are more like $1-2+/hour
  - Non-video entertainment tends to be much more expensive
  - Social benefits may accrue from shared viewing
  - Other streaming services may be competitive
Producer surplus
  - NFLX spent $13B on content in 2023, 230 million subscribers, about $4.70/user/month
  - Cost structure: High fixed, low marginal
  - Ads likely earning around $4-5 per recipient/month
  - Net profit margin about 20-22% in a competitive category
How can we use customer data?
Businesses have 4, and only 4, ways to make money:
Acquire, develop, retain and “fire” customersThis is called Customer relationship management (CRM): week 9Marketing mix (“4 P’s”): Improve product offerings, prices, promotion, distribution
Incorporate customer heterogeneity for targeting, personalization, recommendations, product development…
Privacy and security, e.g. misuse, theft, regulatory compliance
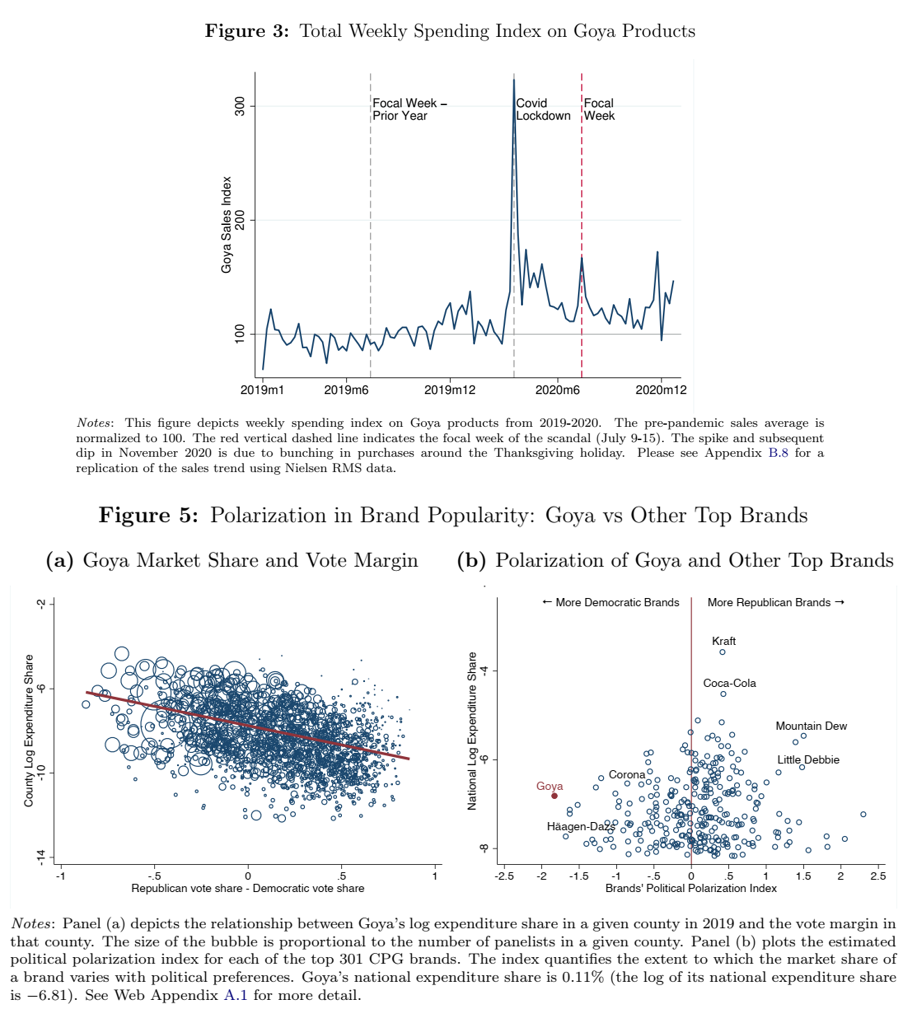
Example: Nielsen
CONSUMER PANEL DATA
- The Consumer Panel Data include longitudinal data beginning in 2004 with annual updates. These data track a panel of 40,000–60,000 US households and their purchases of fast-moving consumer goods from a wide range of retail outlets across all US markets. RETAIL SCANNER DATA
- Retail Scanner Data consist of weekly pricing, volume, and store environment information generated by point-of-sale systems from more than 90 participating retail chains across all US markets. Data begin in 2006 and include annual updates. 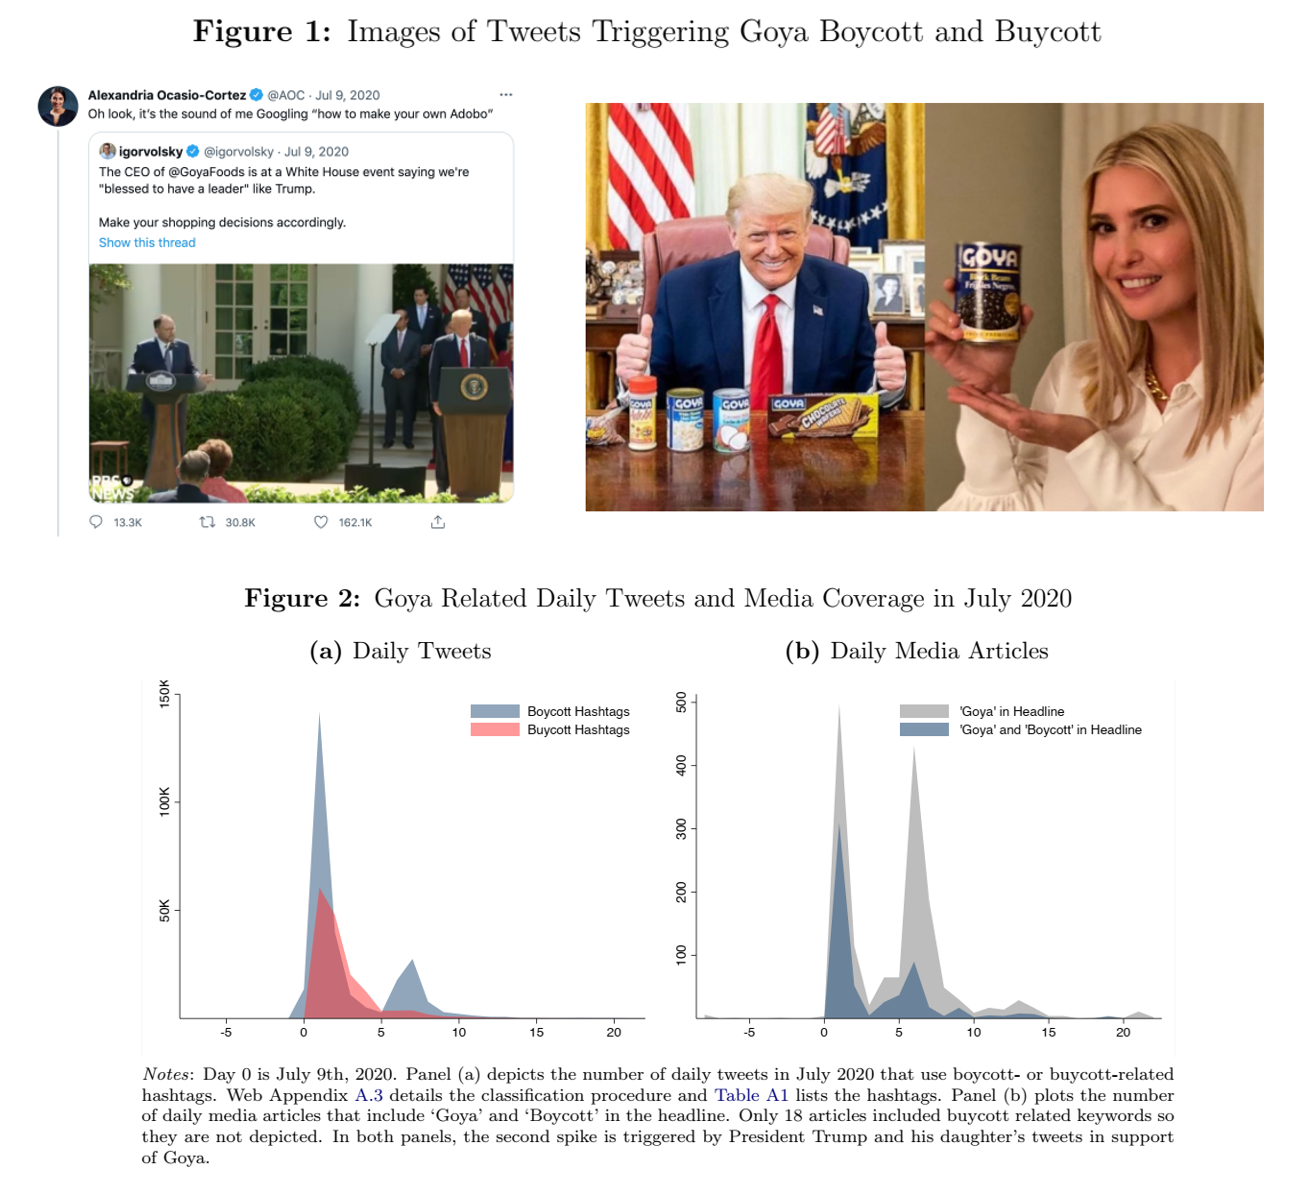
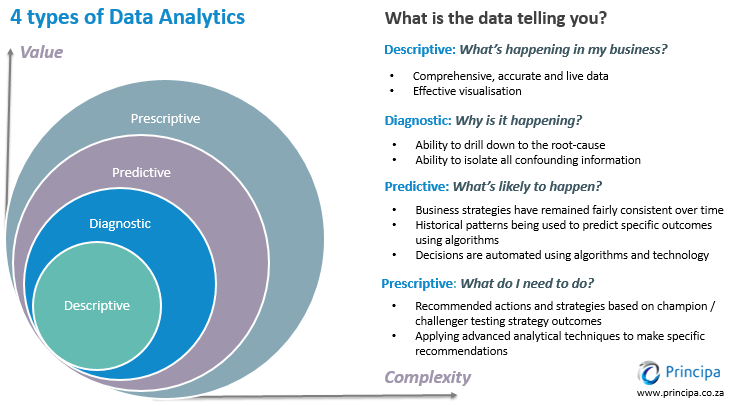

E-commerce Analytics
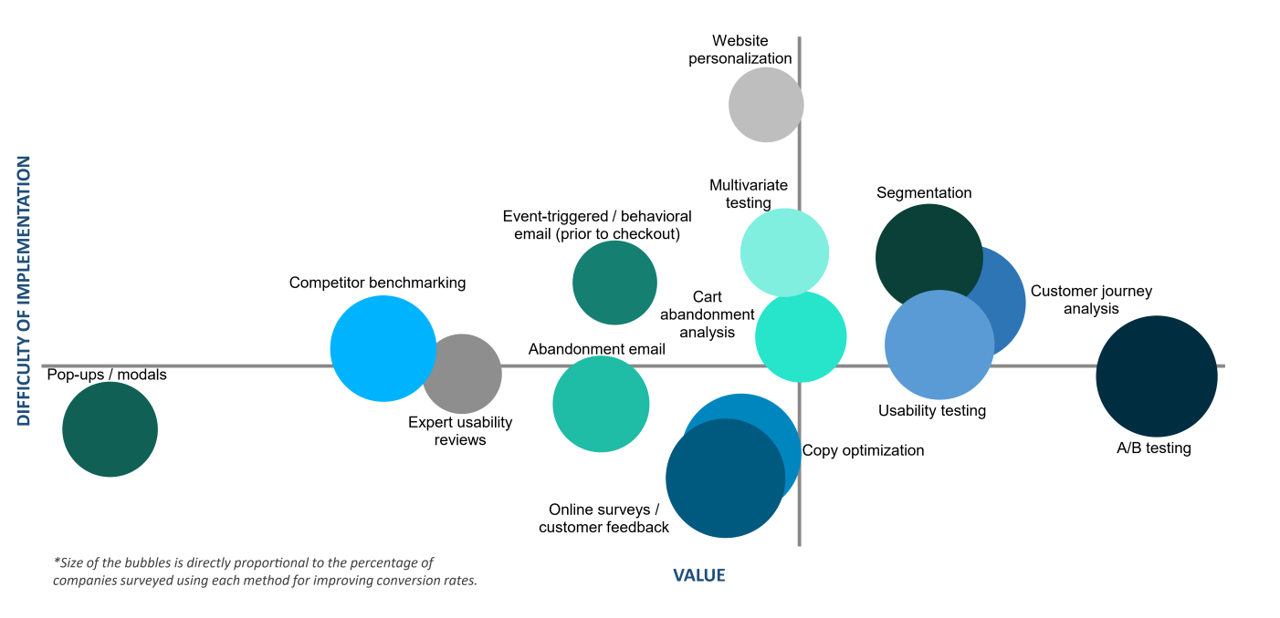
Using Customer Data for Customer Analytics
How do we “do” customer analytics?
- Decide objectives & outcome metrics
- Collect, wrangle, clean & verify relevant data
- Analyze data
- Communicate analyses and recommendations
- Make decisions
- Implement data-driven decisions
- Retrospectively evaluate and improve
- Repeat
- …Once you have a stable process, automate carefully & monitor
Challenges: Executives
- May be territorial, or incentivized to be
- May worry that analytics will constrain or replace them
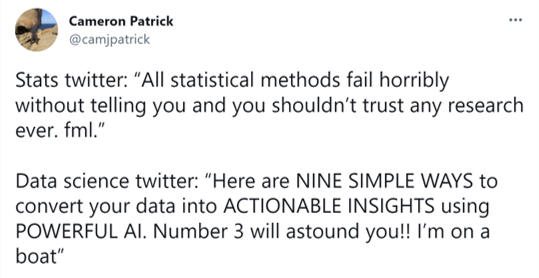
- May think data == magic
- May prefer hunches or misunderstand uncertainty
Challenges: Analysts
- Expensive
- Hard to find
- Not always current
- Not always interested in business
Challenges: Cultural
Do analytics make or justify decisions?
High- or low-trust environment? Tolerance for uncertainty?
- You have limited credibility. You may only get a few strikesDo messengers get rewarded or shot?
Are data available and integrated?
Do teams work together or compete?
Signs of a great analytics org
- C-level champion(s), i.e. C{D,E,A,F,M,O}O
- Centralized team regulates data, arch., standards & tools
- Decentralized analysts collaborate with execs
- Analytics career tracks are well established
- Careful in-housing/outsourcing decisions about analytics
- Good examples?
Analytics truisms
Analytics matters more in B2C than B2B (why?)
Selection effects are usually large
  treatment effects are usually small
  Key exceptions: Price or "free" giveaways
Demographics don’t predict behavior very well
Agencies lie about data sometimes
“If it’s written in LaTeX, it’s probably correct”
MGT 100
- I am assuming you read the syllabus carefullyCourse Design Principles
Survey the field broadly, pointers for deeper learning
Focus on conceptual understanding:
“When it comes to LLMs, skillful prompting leaves amateurs in the dust.”Strict communication policies
1. Website for class content
2. Canvas for study groups & grades
3. Piazza for all asynchronous interaction. No email or canvas messages
4. After class, break or office hours for live discussions
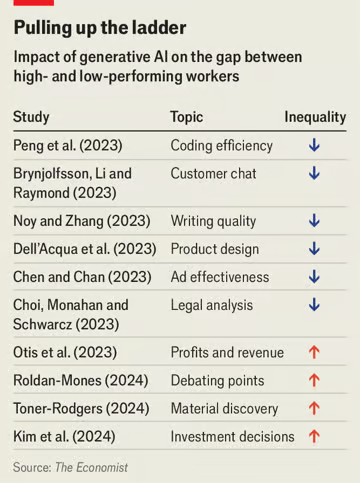
Gen AI effects on productivity
Tips to max your learning
Read the syllabus carefully
Attend and contribute as suggested in the syllabus
Budget 5-10 hours/week
Between classes:
1. Step through script carefully, understand everything.
2. Do homework questions on your own
3. Check homework with group, resolve differences
4. Monitor Piazza and read for the next class
5. Compile notes and homework answers to facilitate exam prep
Studying and Integrity
We assign attending students to study groups in week 2
It is OK to share homework scripts and answers
- We do not collect or assess homeworks.
- We do not provide homework answers.
- Exam questions will test your familiarity and understanding of homework answers. More details forthcoming
We encourage you to use Gen AI thoughtfully; we use it too
- LLMs are poor substitutes for human understanding
- Be advised, you may get what you pay for
- Free models are sometimes worse than useless

- Please write down your intentions for this class.
How will you measure your effort?
Vocab
Common language helps communication
Customer level
Core need: identifiable problem a customer wants to solve. Could be functional, emotional, social, profit-motivated, etc. Related: desire, want, pain point
Core benefit: Customer’s desired outcome of a purchase. E.g., commuters need to get to school, not necessarily cars
Consumer: Entity that experiences the core benefit
Customer: Entity that purchases and pays
Product level
Product/service/experience: Distinct offering that provides the core benefit
Features: Aspects of a product that provide additional tangible or intangible benefits
Value proposition: utility( Core benefit + features - price )
Contribution margin: Price — marginal cost
Competitor: Any paid or free alternative that addresses the core need. E.g., commute by bike, walk, bus, trolley, Uber, scooter, skateboard; work from home
Market level
Market: Potential customer group with common core need
Segment: Distinct subgroup of similar customers
Targeting: Which segment(s) a firm tries to serve
Positioning: Specification of product features to suit targeted segments
Marketing: Practice of meeting customer needs profitably
  - Marketing: Business discipline that focuses most on customers
  - Ads & sales: Worthless without good value prop and positive margin
  - Poor implementation commonly leads to confusion with bullshit ("persuasive speech without regard for the truth" --Frankfurt 2005)
Legacy Terms
3/4/5 C’s: Customer, Competitor, Company;
Context; ComplementorsSTP: Segmentation, Targeting, Positioning AKA Marketing Strategy
4/…/10 P’s:
Price, Product, Promotion, Place AKA distribution AKA Marketing Tactics- You need to know these well if you interview for marketing roles - Generations of marketing professionals were educated to think this way, e.g. MGT 103 and Harvard MBAs - Still relevant, but less, thanks to customer data abundance & analytics
Coding & Script
Coding errors
“The good news about computers is that they do what you tell them to do. The bad news is that they do what you tell them to do.”
Conjecture:
(debugging difficulty) is exponential in (lines of code)We can code fast or slow
Coding Habits
Good habit: Test chunks as you code
Test = Manipulate text, verify output matches expectation
“Go slow to go fast”
![]()
Pipe |>
y <- f(g(x)) is the same as
y <- x |>
g |>
f
Why?
Old pipe was %>% ; remains widely used
Today’s script
- Install/update R and Rstudio
- Posit.Cloud
- Data Import/export
- Data manipulation, summarization
- 5 verbs: Summarize, select, filter, arrange, mutate, group_by
- Univariate statistics
- Univariate plots
- Bivariate statistics
- Bivariate plots

Wrapping up
Recap
Customer analytics :
Using customer data to improve decisionsData Viz should be the first step in customer analytics
Marketing : Meeting customer needs profitably
Analytics types:
Descriptive, Diagnostic, Predictive, PrescriptiveSummarize, select, filter, arrange, mutate, group_by

Going further

